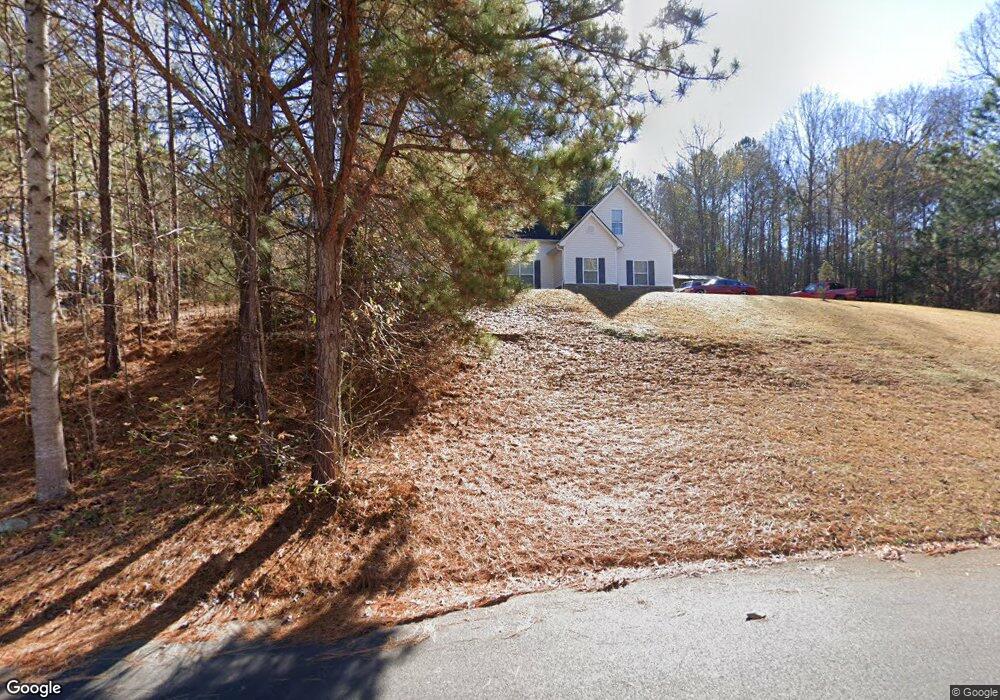
120 Woodstream Trail Lagrange, GA 30240
Estimated Value: $287,738 - $319,000
3
Beds
2
Baths
1,973
Sq Ft
$153/Sq Ft
Est. Value
About This Home
This home is located at 120 Woodstream Trail, Lagrange, GA 30240 and is currently estimated at $302,435, approximately $153 per square foot. 120 Woodstream Trail is a home located in Troup County with nearby schools including Long Cane Elementary School, Berta Weathersbee Elementary School, and West Point Elementary School.
Ownership History
Date
Name
Owned For
Owner Type
Purchase Details
Closed on
Sep 3, 2019
Sold by
Knight Mark
Bought by
Smith Christopher Jason and Smith Crystal Tiffany
Current Estimated Value
Home Financials for this Owner
Home Financials are based on the most recent Mortgage that was taken out on this home.
Original Mortgage
$166,920
Outstanding Balance
$147,730
Interest Rate
4.12%
Mortgage Type
FHA
Estimated Equity
$154,705
Purchase Details
Closed on
Jun 13, 2007
Sold by
Tristone Grp Inc
Bought by
Knight Mark
Home Financials for this Owner
Home Financials are based on the most recent Mortgage that was taken out on this home.
Original Mortgage
$125,000
Interest Rate
6.16%
Mortgage Type
New Conventional
Purchase Details
Closed on
Feb 2, 2007
Sold by
Garner Homes
Bought by
Tristone Grp Inc
Purchase Details
Closed on
Aug 22, 2000
Bought by
C & W Dev Inc
Create a Home Valuation Report for This Property
The Home Valuation Report is an in-depth analysis detailing your home's value as well as a comparison with similar homes in the area
Home Values in the Area
Average Home Value in this Area
Purchase History
| Date | Buyer | Sale Price | Title Company |
|---|---|---|---|
| Smith Christopher Jason | $170,000 | -- | |
| Knight Mark | $160,000 | -- | |
| Tristone Grp Inc | $100,000 | -- | |
| Tristone Grp Inc | $100,000 | -- | |
| C & W Dev Inc | -- | -- |
Source: Public Records
Mortgage History
| Date | Status | Borrower | Loan Amount |
|---|---|---|---|
| Open | Smith Christopher Jason | $166,920 | |
| Previous Owner | Knight Mark | $125,000 |
Source: Public Records
Tax History Compared to Growth
Tax History
| Year | Tax Paid | Tax Assessment Tax Assessment Total Assessment is a certain percentage of the fair market value that is determined by local assessors to be the total taxable value of land and additions on the property. | Land | Improvement |
|---|---|---|---|---|
| 2024 | $2,715 | $99,560 | $14,000 | $85,560 |
| 2023 | $2,618 | $96,000 | $10,000 | $86,000 |
| 2022 | $2,098 | $75,160 | $10,000 | $65,160 |
| 2021 | $2,248 | $74,520 | $10,000 | $64,520 |
| 2020 | $2,051 | $72,520 | $8,000 | $64,520 |
| 2019 | $1,874 | $64,120 | $8,000 | $56,120 |
| 2018 | $1,788 | $61,280 | $8,000 | $53,280 |
| 2017 | $1,788 | $61,280 | $8,000 | $53,280 |
| 2016 | $1,737 | $59,577 | $8,000 | $51,577 |
| 2015 | $1,740 | $59,586 | $10,000 | $49,586 |
| 2014 | $1,626 | $55,714 | $7,000 | $48,714 |
| 2013 | -- | $52,039 | $7,000 | $45,039 |
Source: Public Records
Map
Nearby Homes
- 0 Lower Glass Bridge Rd Unit 10507389
- 5714 W Point Rd
- 394 Ferrell Tatum Rd
- 0 Robert Hayes Rd Unit 10611067
- 1248 Cannonville Rd
- 108 Hidden Springs Dr
- 1565 Glass Bridge Rd
- 102 Franklin Place
- 119 Plymouth Dr
- 101 Ivy Springs Dr
- 106 Landings Way
- 141 Plymouth Dr
- 102 Landings Way
- 90 Hickory Ln
- 101 Riverbluff Dr
- 109 Riverbluff Dr
- 201 Lakeview Ct
- 474 Newton Rd
- 40 River Point Dr
- 105 Hawthorne Cir
- 202 Lakeside Dr
- 118 Woodstream Trail
- 201 Lakeside Dr
- 201 Lakeside Dr
- 201 203 203 Lakeside Dr Unit LT 38
- 0 Lakeside Dr Unit 3084641
- 0 Lakeside Dr Unit 3084634
- 0 Lakeside Dr Unit 9069013
- 0 Lakeside Dr Unit 9028156
- 0 Lakeside Dr Unit Lot 38 8599232
- 0 Lakeside Dr Unit 8599138
- 0 Lakeside Dr Unit Lot 38
- 117 Woodstream Trail
- 115 Woodstream Trail
- 38 Lakeside Dr
- 38 Lakeside Dr Unit LOT 38
- 300 Lakeside Dr
- 302 Lakeside Dr
- 103 River Bend Ct
- 113 Woodstream Trail