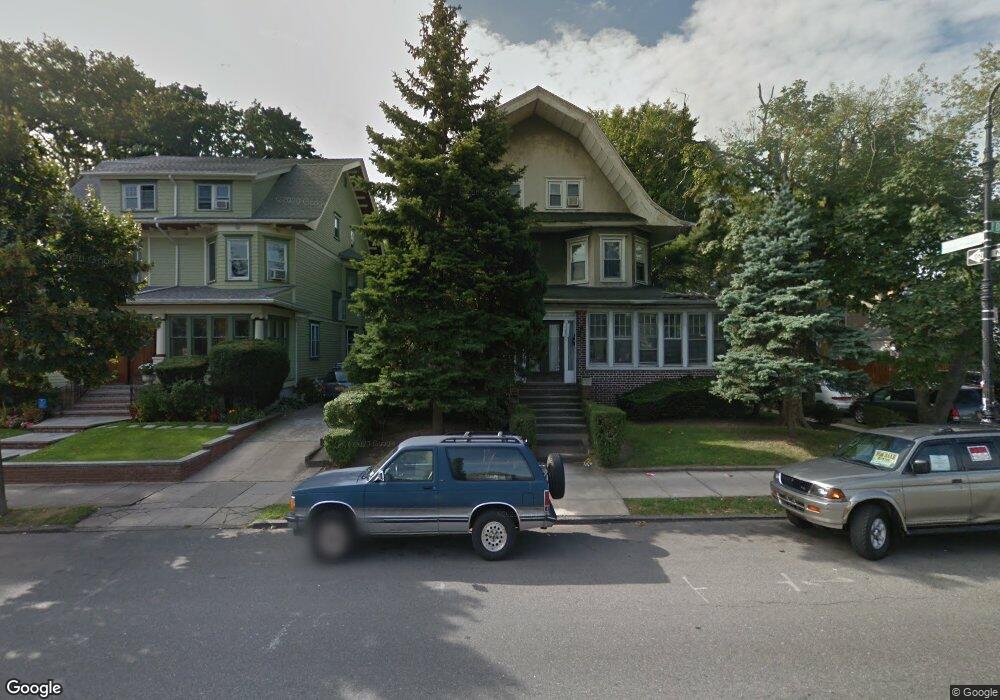
1200 Beverley Rd Brooklyn, NY 11218
Ditmas Park NeighborhoodEstimated Value: $2,323,000 - $4,497,219
--
Bed
--
Bath
5,136
Sq Ft
$664/Sq Ft
Est. Value
About This Home
This home is located at 1200 Beverley Rd, Brooklyn, NY 11218 and is currently estimated at $3,410,110, approximately $663 per square foot. 1200 Beverley Rd is a home located in Kings County with nearby schools including P.S. 139 Alexine a Fenty, Ditmas Junior High school, and Mesivta Torah Vodaath.
Ownership History
Date
Name
Owned For
Owner Type
Purchase Details
Closed on
Aug 16, 2004
Sold by
Burak Deborah and Knight Jason
Bought by
Burak Debora and Knight Jason
Current Estimated Value
Home Financials for this Owner
Home Financials are based on the most recent Mortgage that was taken out on this home.
Original Mortgage
$66,500
Outstanding Balance
$33,913
Interest Rate
6.43%
Estimated Equity
$3,376,197
Purchase Details
Closed on
Oct 2, 2003
Sold by
Hoxha Abdullah and Hoxha Afrim
Bought by
Burak Deborah and Knight Jason
Home Financials for this Owner
Home Financials are based on the most recent Mortgage that was taken out on this home.
Original Mortgage
$532,000
Interest Rate
6.43%
Mortgage Type
Purchase Money Mortgage
Purchase Details
Closed on
Jun 11, 2002
Sold by
Hoxha Abdullah
Bought by
Hoxha Abdullah and Hoxha Robert
Create a Home Valuation Report for This Property
The Home Valuation Report is an in-depth analysis detailing your home's value as well as a comparison with similar homes in the area
Home Values in the Area
Average Home Value in this Area
Purchase History
| Date | Buyer | Sale Price | Title Company |
|---|---|---|---|
| Burak Debora | -- | -- | |
| Burak Debora | -- | -- | |
| Burak Deborah | $665,000 | -- | |
| Burak Deborah | $665,000 | -- | |
| Hoxha Abdullah | -- | -- | |
| Hoxha Abdullah | -- | -- |
Source: Public Records
Mortgage History
| Date | Status | Borrower | Loan Amount |
|---|---|---|---|
| Open | Burak Deborah | $66,500 | |
| Closed | Burak Deborah | $66,500 | |
| Previous Owner | Burak Deborah | $532,000 |
Source: Public Records
Tax History Compared to Growth
Tax History
| Year | Tax Paid | Tax Assessment Tax Assessment Total Assessment is a certain percentage of the fair market value that is determined by local assessors to be the total taxable value of land and additions on the property. | Land | Improvement |
|---|---|---|---|---|
| 2025 | $10,635 | $274,980 | $43,620 | $231,360 |
| 2024 | $10,635 | $240,780 | $43,620 | $197,160 |
| 2023 | $10,754 | $270,960 | $43,620 | $227,340 |
| 2022 | $10,490 | $229,020 | $43,620 | $185,400 |
| 2021 | $10,433 | $176,820 | $43,620 | $133,200 |
| 2020 | $4,893 | $173,820 | $43,620 | $130,200 |
| 2019 | $9,231 | $138,180 | $43,620 | $94,560 |
| 2018 | $8,995 | $44,125 | $12,362 | $31,763 |
| 2017 | $8,927 | $43,791 | $12,653 | $31,138 |
| 2016 | $8,259 | $41,313 | $16,113 | $25,200 |
| 2015 | $4,763 | $38,976 | $22,804 | $16,172 |
| 2014 | $4,763 | $36,771 | $18,284 | $18,487 |
Source: Public Records
Map
Nearby Homes
- 209 Argyle Rd Unit HOUSE
- 194 Rugby Rd
- 231 Argyle Rd
- 1023 Beverley Rd
- 202 Marlborough Rd
- 1221 Albemarle Rd
- 1305 Albemarle Rd
- 301 Rugby Rd
- 812 Beverley Rd
- 1109 Church Ave
- 68 Stratford Rd Unit 10
- 336 E 16th St
- 192 E 8th St Unit 4D
- 116 Buckingham Rd
- 904 Avenue C
- 375 E 7th St
- 271 Church Ave
- 395 E 7th St
- 39 Argyle Rd Unit 3 D
- 39 Argyle Rd Unit 3 A
- 1208 Beverley Rd
- 209 Westminster Rd
- 1212 Beverley Rd
- 1116 Beverley Rd
- 215 Westminster Rd
- 1214 Beverley Rd
- 216 Westminster Rd
- 216 Westminster Rd Unit 1
- 226 Argyle Rd
- 1216 Beverley Rd
- 1112 Beverley Rd Unit 2
- 1112 Beverley Rd
- 219 Westminster Rd
- 232 Argyle Rd
- 232 Argyle Rd Unit Building
- 1203 Beverley Rd
- 220 Westminster Rd
- 208 Argyle Rd
- 198 Westminster Rd
- 1108 Beverley Rd