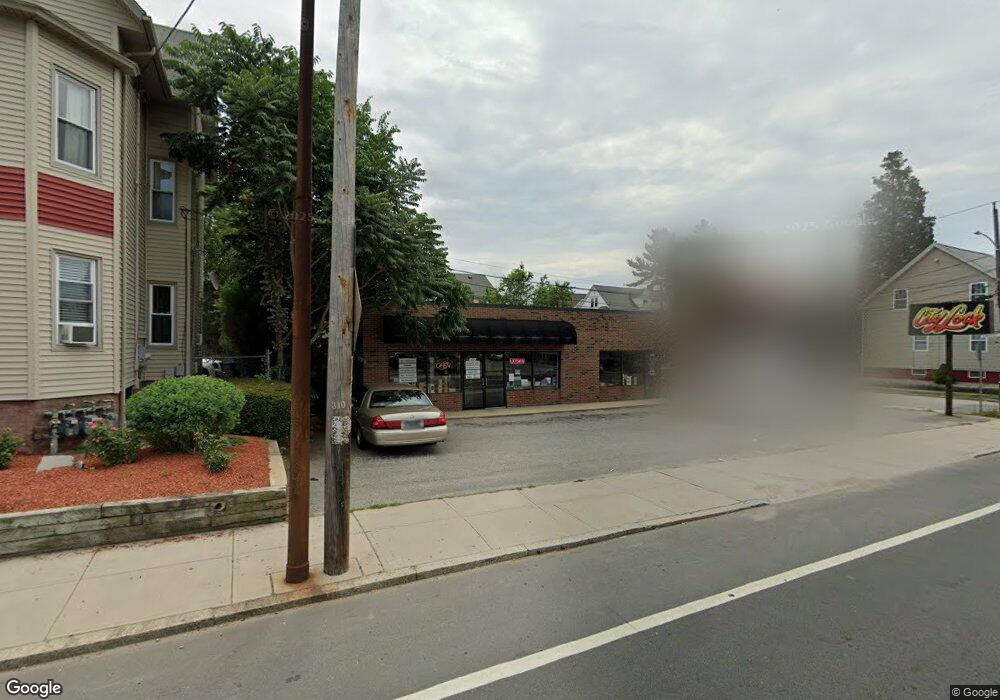
1200 Elmwood Ave Providence, RI 02907
South Elmwood NeighborhoodEstimated Value: $605,780
--
Bed
--
Bath
2,200
Sq Ft
$275/Sq Ft
Est. Value
About This Home
This home is located at 1200 Elmwood Ave, Providence, RI 02907 and is currently estimated at $605,780, approximately $275 per square foot. 1200 Elmwood Ave is a home located in Providence County with nearby schools including Asa Messer Elementary School, Charles N. Fortes Elementary School, and Alfred Lima Sr. Elementary School.
Ownership History
Date
Name
Owned For
Owner Type
Purchase Details
Closed on
Oct 9, 2024
Sold by
City Lock Svc & Supply Co
Bought by
Cournova Joshua and Cournova Sara
Current Estimated Value
Home Financials for this Owner
Home Financials are based on the most recent Mortgage that was taken out on this home.
Original Mortgage
$430,000
Outstanding Balance
$425,055
Interest Rate
6.35%
Mortgage Type
Commercial
Estimated Equity
$180,725
Create a Home Valuation Report for This Property
The Home Valuation Report is an in-depth analysis detailing your home's value as well as a comparison with similar homes in the area
Home Values in the Area
Average Home Value in this Area
Purchase History
| Date | Buyer | Sale Price | Title Company |
|---|---|---|---|
| Cournova Joshua | $580,000 | None Available | |
| Cournova Joshua | $580,000 | None Available |
Source: Public Records
Mortgage History
| Date | Status | Borrower | Loan Amount |
|---|---|---|---|
| Open | Cournova Joshua | $430,000 | |
| Closed | Cournova Joshua | $430,000 |
Source: Public Records
Tax History Compared to Growth
Tax History
| Year | Tax Paid | Tax Assessment Tax Assessment Total Assessment is a certain percentage of the fair market value that is determined by local assessors to be the total taxable value of land and additions on the property. | Land | Improvement |
|---|---|---|---|---|
| 2025 | $15,403 | $527,500 | $170,600 | $356,900 |
| 2024 | $7,582 | $216,000 | $103,400 | $112,600 |
| 2023 | $7,582 | $216,000 | $103,400 | $112,600 |
| 2022 | $7,646 | $216,000 | $103,400 | $112,600 |
| 2021 | $7,358 | $200,500 | $90,500 | $110,000 |
| 2020 | $7,358 | $200,500 | $90,500 | $110,000 |
| 2019 | $7,358 | $200,500 | $90,500 | $110,000 |
| 2018 | $7,402 | $201,700 | $90,500 | $111,200 |
| 2017 | $7,402 | $201,700 | $90,500 | $111,200 |
| 2016 | $7,402 | $201,700 | $90,500 | $111,200 |
| 2015 | $5,976 | $162,600 | $86,200 | $76,400 |
| 2014 | $5,976 | $162,600 | $86,200 | $76,400 |
| 2013 | $5,976 | $162,600 | $86,200 | $76,400 |
Source: Public Records
Map
Nearby Homes