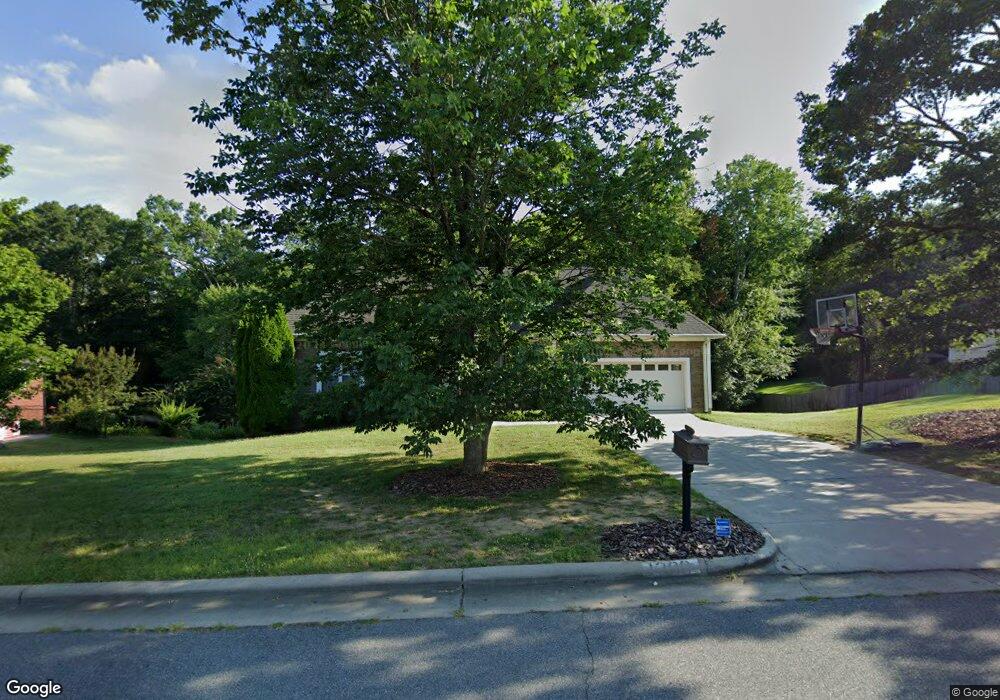
1200 N Windsor Dr Unit Lot 1 Kannapolis, NC 28081
Estimated Value: $475,000 - $571,000
4
Beds
3
Baths
2,110
Sq Ft
$242/Sq Ft
Est. Value
About This Home
This home is located at 1200 N Windsor Dr Unit Lot 1, Kannapolis, NC 28081 and is currently estimated at $510,347, approximately $241 per square foot. 1200 N Windsor Dr Unit Lot 1 is a home located in Cabarrus County with nearby schools including Shady Brook Elementary School, Kannapolis Middle, and A.L. Brown High School.
Ownership History
Date
Name
Owned For
Owner Type
Purchase Details
Closed on
Apr 1, 2014
Sold by
Secu Re Inc
Bought by
Whitehead Andrew and Whitehead Lindsay
Current Estimated Value
Home Financials for this Owner
Home Financials are based on the most recent Mortgage that was taken out on this home.
Original Mortgage
$224,000
Outstanding Balance
$169,913
Interest Rate
4.36%
Mortgage Type
New Conventional
Estimated Equity
$340,434
Purchase Details
Closed on
Nov 26, 2013
Sold by
State Employees Cu
Bought by
Secu Re Inc
Purchase Details
Closed on
Oct 30, 2013
Sold by
Spasoff Alison M and Spasoff Richard K
Bought by
State Employees Cu
Purchase Details
Closed on
Jul 26, 2006
Sold by
Kannapolis Real Estate Agency Inc
Bought by
Spasoff Richard K and Spasoff Alison M
Home Financials for this Owner
Home Financials are based on the most recent Mortgage that was taken out on this home.
Original Mortgage
$236,000
Interest Rate
6.6%
Mortgage Type
Purchase Money Mortgage
Create a Home Valuation Report for This Property
The Home Valuation Report is an in-depth analysis detailing your home's value as well as a comparison with similar homes in the area
Home Values in the Area
Average Home Value in this Area
Purchase History
| Date | Buyer | Sale Price | Title Company |
|---|---|---|---|
| Whitehead Andrew | $244,000 | None Available | |
| Secu Re Inc | $214,500 | None Available | |
| State Employees Cu | $220,886 | None Available | |
| Spasoff Richard K | $295,000 | None Available |
Source: Public Records
Mortgage History
| Date | Status | Borrower | Loan Amount |
|---|---|---|---|
| Open | Whitehead Andrew | $224,000 | |
| Previous Owner | Spasoff Richard K | $236,000 |
Source: Public Records
Tax History Compared to Growth
Tax History
| Year | Tax Paid | Tax Assessment Tax Assessment Total Assessment is a certain percentage of the fair market value that is determined by local assessors to be the total taxable value of land and additions on the property. | Land | Improvement |
|---|---|---|---|---|
| 2025 | $5,758 | $507,110 | $100,000 | $407,110 |
| 2024 | $5,758 | $507,110 | $100,000 | $407,110 |
| 2023 | $5,080 | $370,790 | $60,000 | $310,790 |
| 2022 | $5,080 | $370,790 | $60,000 | $310,790 |
| 2021 | $5,080 | $370,790 | $60,000 | $310,790 |
| 2020 | $5,080 | $370,790 | $60,000 | $310,790 |
| 2019 | $4,326 | $315,790 | $40,000 | $275,790 |
| 2018 | $3,724 | $275,830 | $40,000 | $235,830 |
| 2017 | $3,669 | $275,830 | $40,000 | $235,830 |
| 2016 | $3,669 | $279,730 | $58,000 | $221,730 |
| 2015 | $3,508 | $278,390 | $58,000 | $220,390 |
| 2014 | $3,508 | $278,390 | $58,000 | $220,390 |
Source: Public Records
Map
Nearby Homes
- 901 Brighton Dr
- 2009 Independence Square
- 2609 Lamp Post Ln
- 1524 Candlewyck Ct
- 1700 Oakwood Ave
- 1229 Brecken Ct
- 1828 Independence Square
- 2605 Lamplighter Dr
- 2073 Hambridge Ave
- 837 Lantern Way
- 1902 Stonewyck Ave
- 1656 Heather Glen Rd
- 1933 Stonewyck Ave
- 1441 Sherwood Dr
- 2645 Watts Ave
- 1693 Azalea Ave
- 3203 Kelsey Plaza
- 2129 Norwich Ct
- 1620 Longbow Dr
- 2448 Spruce St
- 1200 N Windsor Dr
- 1156 N Windsor Dr
- 1204 N Windsor Dr
- 791 Brighton Dr
- 1152 N Windsor Dr
- 1208 N Windsor Dr
- Lot 54 Windsor Dr Unit 54
- 1157 N Windsor Dr
- 1209 N Windsor Dr
- 1153 N Windsor Dr
- 801 Brighton Dr
- 1148 N Windsor Dr
- 1212 N Windsor Dr
- 1520 Oakwood Ave
- 1101 S Windsor Dr
- 1213 N Windsor Dr
- 1149 N Windsor Dr
- 805 Brighton Dr
- 1105 S Windsor Dr
- 1144 N Windsor Dr