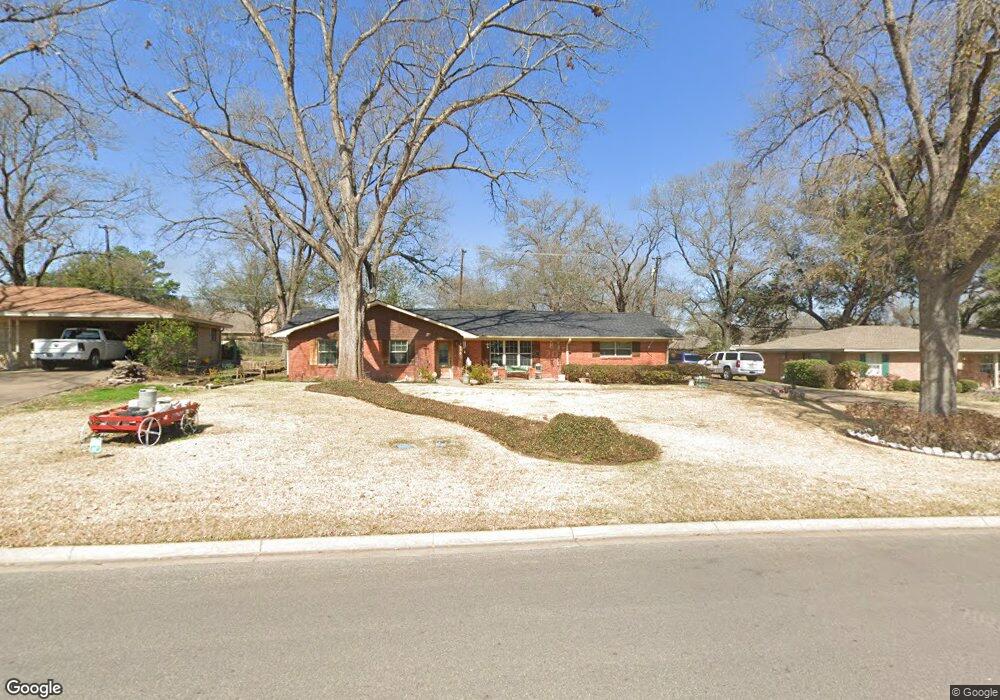
1200 Oaklawn Dr Corsicana, TX 75110
Estimated Value: $278,743 - $322,000
3
Beds
2
Baths
1,969
Sq Ft
$152/Sq Ft
Est. Value
About This Home
This home is located at 1200 Oaklawn Dr, Corsicana, TX 75110 and is currently estimated at $298,936, approximately $151 per square foot. 1200 Oaklawn Dr is a home located in Navarro County with nearby schools including Corsicana High School and William Tyndale Christian Academy.
Ownership History
Date
Name
Owned For
Owner Type
Purchase Details
Closed on
May 8, 2017
Sold by
Hinojosa Eliseo
Bought by
Hinojosa Patricia M
Current Estimated Value
Home Financials for this Owner
Home Financials are based on the most recent Mortgage that was taken out on this home.
Original Mortgage
$122,400
Outstanding Balance
$101,179
Interest Rate
3.97%
Mortgage Type
Purchase Money Mortgage
Estimated Equity
$197,757
Purchase Details
Closed on
Sep 18, 2015
Sold by
Weirich Brian and Weirich Kenna
Bought by
Hinojosa Eliseo and Hinojosa Patricia
Home Financials for this Owner
Home Financials are based on the most recent Mortgage that was taken out on this home.
Original Mortgage
$122,400
Interest Rate
4.12%
Mortgage Type
Adjustable Rate Mortgage/ARM
Purchase Details
Closed on
May 10, 2007
Sold by
Cross Creek Cattle Inc
Bought by
Abbe Chris
Home Financials for this Owner
Home Financials are based on the most recent Mortgage that was taken out on this home.
Original Mortgage
$132,000
Interest Rate
6.13%
Mortgage Type
Purchase Money Mortgage
Create a Home Valuation Report for This Property
The Home Valuation Report is an in-depth analysis detailing your home's value as well as a comparison with similar homes in the area
Home Values in the Area
Average Home Value in this Area
Purchase History
| Date | Buyer | Sale Price | Title Company |
|---|---|---|---|
| Hinojosa Patricia M | -- | None Available | |
| Hinojosa Eliseo | -- | None Available | |
| Abbe Chris | -- | None Available |
Source: Public Records
Mortgage History
| Date | Status | Borrower | Loan Amount |
|---|---|---|---|
| Open | Hinojosa Patricia M | $122,400 | |
| Closed | Hinojosa Eliseo | $122,400 | |
| Previous Owner | Abbe Chris | $132,000 |
Source: Public Records
Tax History Compared to Growth
Tax History
| Year | Tax Paid | Tax Assessment Tax Assessment Total Assessment is a certain percentage of the fair market value that is determined by local assessors to be the total taxable value of land and additions on the property. | Land | Improvement |
|---|---|---|---|---|
| 2025 | $5,751 | $303,720 | $44,590 | $259,130 |
| 2024 | $5,988 | $316,230 | $41,160 | $275,070 |
| 2023 | $5,363 | $290,540 | $17,150 | $273,390 |
| 2022 | $4,735 | $204,490 | $17,150 | $187,340 |
| 2021 | $4,563 | $175,520 | $17,150 | $158,370 |
| 2020 | $4,616 | $173,960 | $17,150 | $156,810 |
| 2019 | $4,655 | $169,510 | $17,150 | $152,360 |
| 2018 | $4,561 | $166,080 | $13,720 | $152,360 |
| 2017 | $4,151 | $151,340 | $13,720 | $137,620 |
| 2016 | $3,953 | $144,110 | $13,720 | $130,390 |
| 2015 | -- | $140,770 | $13,720 | $127,050 |
| 2014 | -- | $120,470 | $13,720 | $106,750 |
Source: Public Records
Map
Nearby Homes
- 1235 Lexington Square
- 1424 Bowie Dr
- 1906 Mimosa Dr
- 1313 Columbia Ave
- 1301 Ficklin Ave
- 1601 Arlington Dr
- 1531 Magnolia Ave
- 800 Imperial Ln
- 2110 Dartmouth Ln
- 1527 Columbia Ave
- 1708 N 26th St
- TBD Lot 56 Northwest Ave
- 1700 Jennifer Cir
- 1000 Bryn Mawr St
- 1004 Bryn Mawr St
- 2000 Cumberland Cir
- 1111 Governors Dr
- 2005 Cumberland Cir
- 1724 N Beaton St
- 110 Woodland Ave
- 1202 Oaklawn Dr
- 1106 Oaklawn Dr
- 1204 Oaklawn Dr
- 1213 Lexington Dr
- 1508 Fairoaks Dr
- 1217 Lexington Dr
- 1104 Oaklawn Dr
- 1215 Lexington Dr
- 1219 Lexington Dr
- 1105 Oaklawn Dr
- 1515 N 22nd St
- 1211 Lexington Dr
- 1300 Oaklawn Dr
- 1102 Oaklawn Dr
- 1222 Lexington Dr
- 1224 Lexington Dr
- 1226 Lexington Dr
- 1220 Lexington Dr
- 1228 Lexington Dr
- 1505 Fairoaks Dr