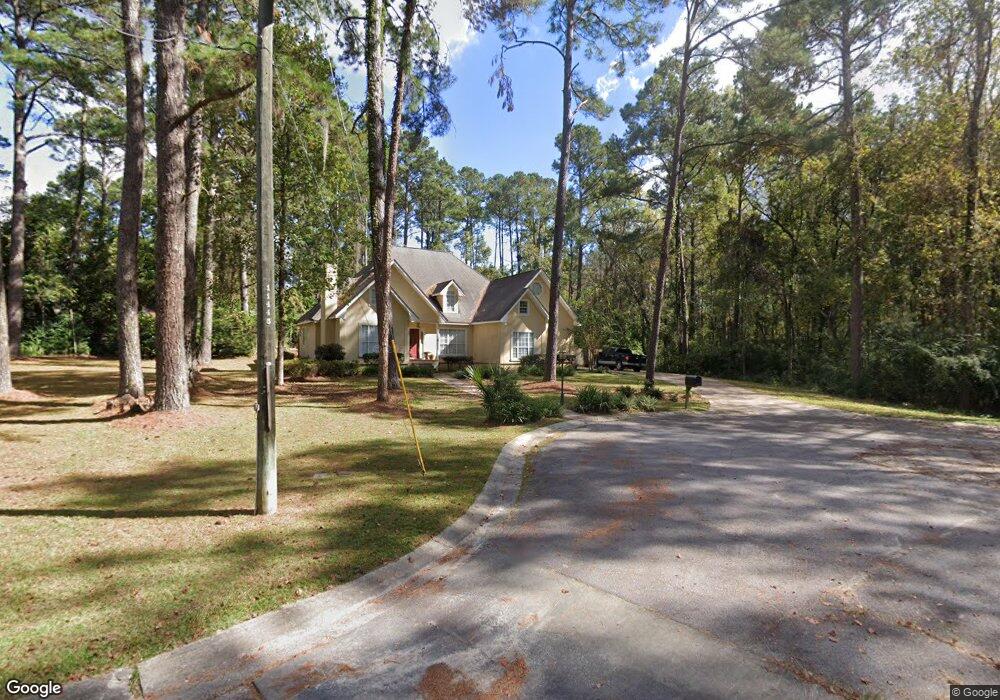
1200 Truman St Waycross, GA 31501
Estimated Value: $410,000 - $490,649
4
Beds
5
Baths
3,384
Sq Ft
$135/Sq Ft
Est. Value
About This Home
This home is located at 1200 Truman St, Waycross, GA 31501 and is currently estimated at $456,412, approximately $134 per square foot. 1200 Truman St is a home located in Ware County with nearby schools including Williams Heights Elementary School, Waycross Middle School, and Ware County High School.
Ownership History
Date
Name
Owned For
Owner Type
Purchase Details
Closed on
Sep 11, 2023
Sold by
Spurlock Harrison A
Bought by
Spurlock Harrison A and Spurlock Mollie J
Current Estimated Value
Home Financials for this Owner
Home Financials are based on the most recent Mortgage that was taken out on this home.
Original Mortgage
$274,595
Outstanding Balance
$176,032
Interest Rate
6.96%
Mortgage Type
New Conventional
Estimated Equity
$280,380
Purchase Details
Closed on
Oct 5, 2017
Sold by
Sasser John E
Bought by
Spurlock Harrison A and Spurlock Mollie J
Home Financials for this Owner
Home Financials are based on the most recent Mortgage that was taken out on this home.
Original Mortgage
$208,800
Interest Rate
3.9%
Mortgage Type
New Conventional
Purchase Details
Closed on
Jun 19, 2017
Sold by
Hines Rosemary Elizabeth
Bought by
Parr Gabriel
Purchase Details
Closed on
Mar 11, 1993
Sold by
Sasser Robert A and Sasser John E
Bought by
Sasser John E and Sasser Gina
Purchase Details
Closed on
Nov 26, 1990
Bought by
Sasser Robert A and Sasser John E
Purchase Details
Closed on
Jun 6, 1986
Create a Home Valuation Report for This Property
The Home Valuation Report is an in-depth analysis detailing your home's value as well as a comparison with similar homes in the area
Home Values in the Area
Average Home Value in this Area
Purchase History
| Date | Buyer | Sale Price | Title Company |
|---|---|---|---|
| Spurlock Harrison A | -- | -- | |
| Spurlock Harrison A | $261,000 | -- | |
| Parr Gabriel | -- | -- | |
| Sasser John E | -- | -- | |
| Sasser Robert A | $6,800 | -- | |
| -- | -- | -- |
Source: Public Records
Mortgage History
| Date | Status | Borrower | Loan Amount |
|---|---|---|---|
| Open | Spurlock Harrison A | $274,595 | |
| Previous Owner | Spurlock Harrison A | $208,800 |
Source: Public Records
Tax History Compared to Growth
Tax History
| Year | Tax Paid | Tax Assessment Tax Assessment Total Assessment is a certain percentage of the fair market value that is determined by local assessors to be the total taxable value of land and additions on the property. | Land | Improvement |
|---|---|---|---|---|
| 2024 | $4,573 | $173,823 | $22,525 | $151,298 |
| 2023 | $4,473 | $171,856 | $34,650 | $137,206 |
| 2022 | $4,962 | $171,856 | $34,650 | $137,206 |
| 2021 | $4,515 | $143,954 | $34,650 | $109,304 |
| 2020 | $4,356 | $137,379 | $34,650 | $102,729 |
| 2019 | $3,485 | $107,789 | $34,650 | $73,139 |
| 2018 | $3,407 | $104,501 | $34,650 | $69,851 |
| 2017 | $3,535 | $104,501 | $34,650 | $69,851 |
| 2016 | $3,535 | $108,415 | $34,650 | $73,765 |
| 2015 | $2,848 | $86,548 | $12,000 | $74,548 |
| 2014 | $2,700 | $86,548 | $12,000 | $74,548 |
| 2013 | -- | $89,534 | $12,000 | $77,534 |
Source: Public Records
Map
Nearby Homes
- 955 Lynn Dr
- 914 Barkley St
- 1049 Riverdale Dr
- 1312 Atlantic Ave
- 723 St Bernard Trail
- 2775 Seminole Trail
- 1504 Danora Dr
- 867 Kentland Dr
- 807 City Blvd
- 1502 Seminole Trail
- 763 Kentland Dr
- 1204 Richmond Ave
- 1617 Moss Creek Rd
- 7438 Central Ave
- 3070 Central Ave
- 1002 Baltimore Ave
- 1400 E Cherokee Dr
- 1622 Booth St
- 1100 Atlantic Ave
- 00 Seminole Trail