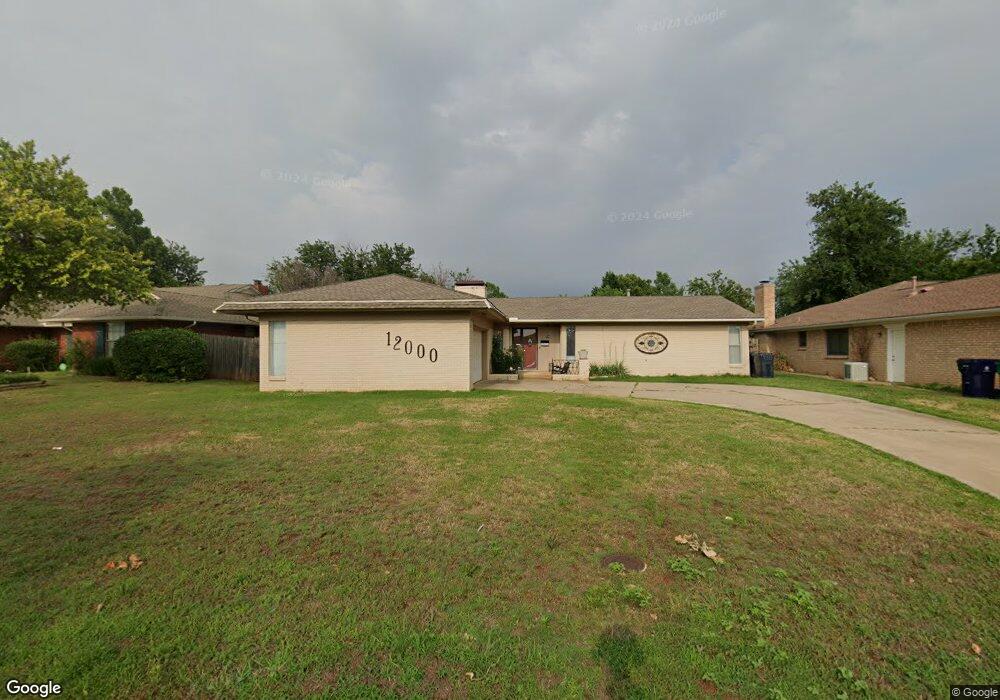
12000 Camelot Dr Oklahoma City, OK 73120
Camelot Bel-Aire NeighborhoodEstimated Value: $226,026 - $250,000
3
Beds
2
Baths
1,807
Sq Ft
$132/Sq Ft
Est. Value
About This Home
This home is located at 12000 Camelot Dr, Oklahoma City, OK 73120 and is currently estimated at $238,507, approximately $131 per square foot. 12000 Camelot Dr is a home located in Oklahoma County with nearby schools including Quail Creek Elementary School, John Marshall Enterprise Middle School, and John Marshall Enterprise High School.
Ownership History
Date
Name
Owned For
Owner Type
Purchase Details
Closed on
Sep 7, 2021
Sold by
Nasr Father Qustandi and Nasr Sharon A
Bought by
Taybeh Llc
Current Estimated Value
Purchase Details
Closed on
Oct 28, 2008
Sold by
Nasr Philip C
Bought by
Nasr Philip C and Nasr Father Qustandi Constantine
Purchase Details
Closed on
Oct 8, 2008
Sold by
Nasr Patricia A and Antonopoulos Patricia
Bought by
Nasr Philip C
Purchase Details
Closed on
Sep 22, 2006
Sold by
Stallsmith Jeff D and Stallsmith Judith C
Bought by
Nasr Philip C and Nasr Patricia A
Home Financials for this Owner
Home Financials are based on the most recent Mortgage that was taken out on this home.
Original Mortgage
$101,600
Interest Rate
6.47%
Mortgage Type
Purchase Money Mortgage
Create a Home Valuation Report for This Property
The Home Valuation Report is an in-depth analysis detailing your home's value as well as a comparison with similar homes in the area
Home Values in the Area
Average Home Value in this Area
Purchase History
| Date | Buyer | Sale Price | Title Company |
|---|---|---|---|
| Taybeh Llc | -- | None Available | |
| Nasr Philip C | -- | Stewart Abstract & Title | |
| Nasr Philip C | -- | None Available | |
| Nasr Philip C | $128,000 | Stewart Abstract & Title Of |
Source: Public Records
Mortgage History
| Date | Status | Borrower | Loan Amount |
|---|---|---|---|
| Previous Owner | Nasr Philip C | $101,600 |
Source: Public Records
Tax History Compared to Growth
Tax History
| Year | Tax Paid | Tax Assessment Tax Assessment Total Assessment is a certain percentage of the fair market value that is determined by local assessors to be the total taxable value of land and additions on the property. | Land | Improvement |
|---|---|---|---|---|
| 2024 | $2,025 | $17,314 | $3,227 | $14,087 |
| 2023 | $2,025 | $16,490 | $3,212 | $13,278 |
| 2022 | $1,847 | $15,704 | $3,647 | $12,057 |
| 2021 | $1,760 | $14,957 | $3,077 | $11,880 |
| 2020 | $1,696 | $14,245 | $3,111 | $11,134 |
| 2019 | $1,691 | $14,206 | $3,044 | $11,162 |
| 2018 | $1,535 | $13,530 | $0 | $0 |
| 2017 | $1,571 | $13,859 | $2,765 | $11,094 |
| 2016 | $1,541 | $13,584 | $2,765 | $10,819 |
| 2015 | $1,513 | $13,213 | $2,765 | $10,448 |
| 2014 | $1,477 | $12,976 | $2,765 | $10,211 |
Source: Public Records
Map
Nearby Homes
- 12104 Camelot Place
- 2728 Camelot Dr
- 2821 NW 117th St
- 11604 N Victoria Dr
- 2524 NW 116th St
- 2501 NW 121st St
- 11520 N May Ave Unit C101
- 11520 N May Ave Unit C 105
- 11550 N May Ave Unit F207
- 11540 N May Ave Unit 108E
- 11372 Benttree Cir Unit 11372
- 2400 NW 121st St
- 12300 Springwood Dr
- 12108 Blue Sage Rd
- 11417 N May Ave Unit B
- 11417 N May Ave Unit D
- 12112 Blue Sage Rd
- 11307 Benttree Cir Unit 11307
- 11314 Benttree Cir Unit 11314
- 11413 N May Ave Unit B
- 12004 Camelot Dr
- 11908 Camelot Dr
- 12021 Camelot Ct
- 12008 Camelot Dr
- 11904 Camelot Dr
- 12001 Camelot Dr
- 2629 NW 118th Cir
- 12017 Camelot Ct
- 12005 Camelot Dr
- 12012 Camelot Dr
- 11909 Camelot Dr
- 11900 Camelot Dr
- 12025 Camelot Ct
- 2625 NW 118th Cir
- 2705 NW 119th St
- 2633 NW 118th Cir
- 12016 Camelot Dr
- 2704 NW 119th St
- 12013 Camelot Ct
- 12013 Camelot Dr