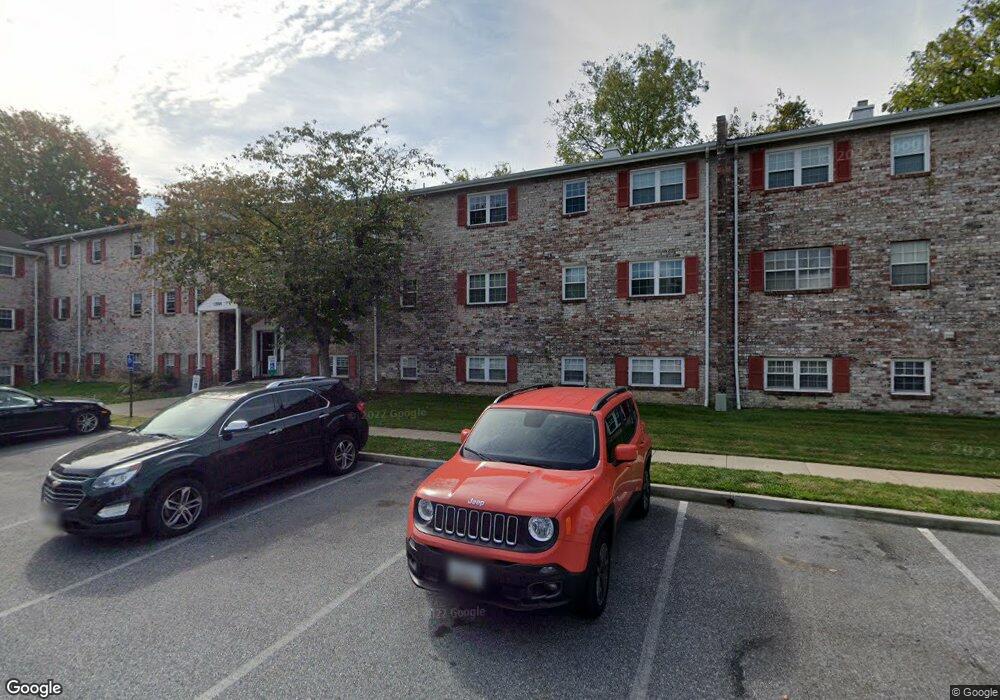
12004D Tarragon Rd Reisterstown, MD 21136
Estimated Value: $122,000 - $134,353
--
Bed
1
Bath
841
Sq Ft
$153/Sq Ft
Est. Value
About This Home
This home is located at 12004D Tarragon Rd, Reisterstown, MD 21136 and is currently estimated at $128,588, approximately $152 per square foot. 12004D Tarragon Rd is a home located in Baltimore County with nearby schools including Cedarmere Elementary School, Franklin Middle, and Franklin High.
Ownership History
Date
Name
Owned For
Owner Type
Purchase Details
Closed on
Jan 5, 2018
Sold by
Zupancic Frank J
Bought by
Kogan Jacob
Current Estimated Value
Home Financials for this Owner
Home Financials are based on the most recent Mortgage that was taken out on this home.
Original Mortgage
$56,000
Outstanding Balance
$47,245
Interest Rate
3.93%
Mortgage Type
New Conventional
Estimated Equity
$81,343
Purchase Details
Closed on
Jul 17, 2017
Sold by
Jackson Justin
Bought by
Zupancic Frank J
Purchase Details
Closed on
Dec 11, 2014
Sold by
Humphreys Randy G and Humphreys Mary C
Bought by
Jackson Justin
Purchase Details
Closed on
Aug 3, 2005
Sold by
Richardson Otto
Bought by
Humphreys Randy G and Humphreys Mary C
Purchase Details
Closed on
Jul 27, 1998
Sold by
Mount Vernon Properties Inc
Bought by
Richardson Otto
Create a Home Valuation Report for This Property
The Home Valuation Report is an in-depth analysis detailing your home's value as well as a comparison with similar homes in the area
Home Values in the Area
Average Home Value in this Area
Purchase History
| Date | Buyer | Sale Price | Title Company |
|---|---|---|---|
| Kogan Jacob | $70,000 | None Available | |
| Zupancic Frank J | $35,000 | None Available | |
| Jackson Justin | $65,000 | Micasa Title Group Llc | |
| Humphreys Randy G | $102,550 | -- | |
| Richardson Otto | $51,900 | -- |
Source: Public Records
Mortgage History
| Date | Status | Borrower | Loan Amount |
|---|---|---|---|
| Open | Kogan Jacob | $56,000 |
Source: Public Records
Tax History Compared to Growth
Tax History
| Year | Tax Paid | Tax Assessment Tax Assessment Total Assessment is a certain percentage of the fair market value that is determined by local assessors to be the total taxable value of land and additions on the property. | Land | Improvement |
|---|---|---|---|---|
| 2025 | $1,936 | $82,667 | -- | -- |
| 2024 | $1,936 | $71,500 | $18,000 | $53,500 |
| 2023 | $1,897 | $71,500 | $18,000 | $53,500 |
| 2022 | $805 | $71,500 | $18,000 | $53,500 |
| 2021 | $824 | $71,500 | $18,000 | $53,500 |
| 2020 | $824 | $68,000 | $0 | $0 |
| 2019 | $782 | $64,500 | $0 | $0 |
| 2018 | $739 | $61,000 | $18,000 | $43,000 |
| 2017 | $1,433 | $59,333 | $0 | $0 |
| 2016 | -- | $57,667 | $0 | $0 |
| 2015 | $1,408 | $56,000 | $0 | $0 |
| 2014 | $1,408 | $56,000 | $0 | $0 |
Source: Public Records
Map
Nearby Homes
- 11906 Tarragon Rd Unit I
- 11906 Tarragon Rd Unit J
- 11902 Tarragon Rd Unit A
- 11921 Tarragon Rd Unit H
- 601 Quicksilver Ct Unit 203
- 119 W Cherry Hill Rd
- 600 Quarry Place Ct
- 606 Quarry Place Ct
- 608 Quarry Place Ct
- 614 Quarry Place Ct
- 616 Quarry Place Ct
- 588 Quarry Place Ct
- 624 Quarry Place Ct
- 626 Quarry Place Ct
- 605 Quarry View Ct Unit 307
- 305 Cherrystone Ct
- 8 Beau Mondes Ct
- 514 Halite Dr
- 704 Pineapple Ct
- 705 Pineapple Ct
- 12010L Tarragon Rd
- 12010K Tarragon Rd
- 12010J Tarragon Rd
- 12010I Tarragon Rd
- 12010H Tarragon Rd
- 12010G Tarragon Rd
- 12010F Tarragon Rd
- 12010D Tarragon Rd
- 12010B Tarragon Rd
- 12010A Tarragon Rd
- 12006L Tarragon Rd
- 12006J Tarragon Rd
- 12006H Tarragon Rd
- 12006G Tarragon Rd
- 12006F Tarragon Rd
- 12006B Tarragon Rd
- 12006A Tarragon Rd
- 12004A Tarragon Rd
- 12000L Tarragon Rd
- 12000K Tarragon Rd