NOT LISTED FOR SALE

12008 Wimbleton St Upper Marlboro, MD 20774

Estimated Value: $480,000 - $568,000

4 Beds
3 Baths
2,502 Sq Ft
$211/Sq Ft Est. Value

Last Sold February 27, 2015

Last sale price $329,000 $131 Per Sq Ft

Est. 60% increase in value since last sale

Current estimated payment $3,221/month

About This Home

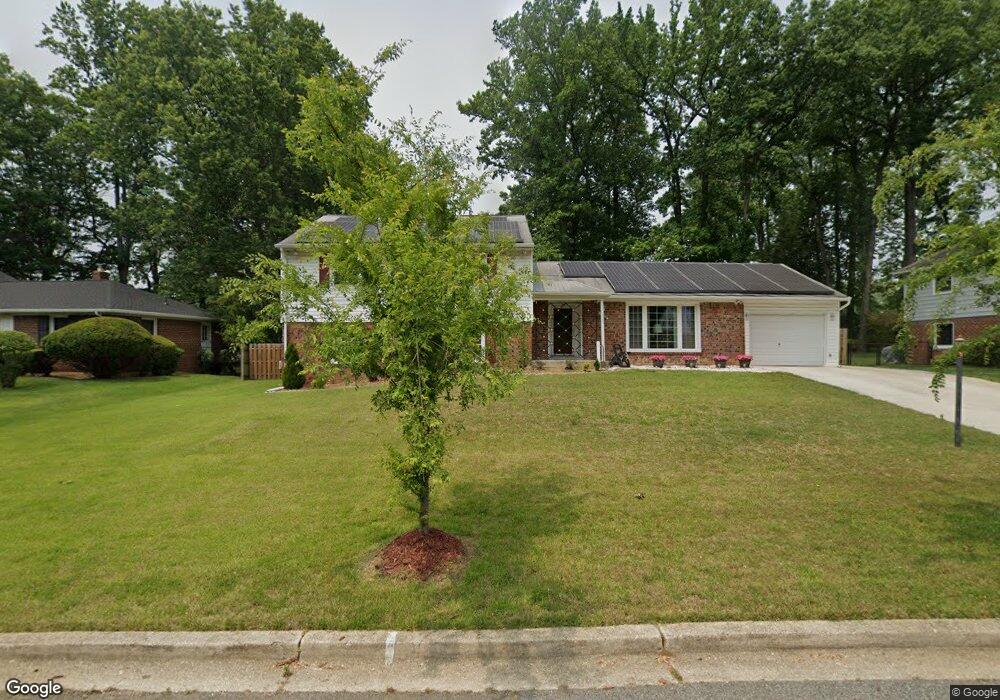
This home is located at 12008 Wimbleton St, Upper Marlboro, MD 20774 and is currently estimated at $527,708, approximately $210 per square foot. 12008 Wimbleton St is a home located in Prince George's County with nearby schools including Perrywood Elementary School, Kettering Middle School, and Largo High School.

Ownership History

Date Name Owned For Owner Type

Purchase Details

Listed on
Jun 19, 2014
Closed on
Feb 26, 2015
Sold by
Jordan Derrick Ray
Bought by
Buggs Debra J and Buggs Steve M
Seller's Agent
Derek Davis
Keller Williams Preferred Properties
Buyer's Agent
Daniel Milliken
Coldwell Banker Elite
List Price
$364,900
Sold Price
$329,000
Premium/Discount to List
-$35,900
-9.84%
Current Estimated Value
$527,708

Home Financials for this Owner

Home Financials are based on the most recent Mortgage that was taken out on this home.
Estimated Appreciation
$198,708
Avg. Annual Appreciation
4.53%
Original Mortgage
$323,040
Outstanding Balance
$248,425
Interest Rate
3.87%
Mortgage Type
FHA
Estimated Equity
$279,283

Purchase Details

Closed on
Feb 14, 1992
Sold by
Myers David A
Bought by
Jordan Derrick R
Source: Public Records

Range of Values:

Collateral Analytics

Collateral Analytics Collateral Analytics AVMs (Automated Valuation Model) employ a number of statistical approaches combined with neighborhood-specific comparable selection guarantees the most up-to-date and precise valuations.

Not Available

Collateral Analytics does not have data for the current month. Please view the chart for historical values.

ICE

ICE Mortgage Technology ICE Mortgage Technology’s AVM (Automated Valuation Model) is a state-of-the-art online residential property valuation tool that provides a quick and accurate estimate of the value of almost any home in the U.S.

Not Available

ICE Mortgage Technology does not have data for the current month. Please view the chart for historical values.

First American

First American First American Data & Analytics’ next-generation AVM combines unrivaled data assets with a blended ensemble of valuation models to produce highly accurate, reliable valuations you can trust.

Not Available

First American does not have data for the current month. Please view the chart for historical values.

Quantarium

Quantarium Quantarium’s valuation service, repeatedly proven the industry’s most accurate and comprehensive, is supercharged with a self-learning and auto-tuning AI engine that continually becomes smarter and more accurate as it processes daily inputs from the industry’s leading RE data lake.

Not Available

Quantarium does not have data for the current month. Please view the chart for historical values.

Average Value
Not Available
List Price
Sold Price
Create a Home Valuation Report for This Property
The Home Valuation Report is an in-depth analysis detailing your home's value as well as a comparison with similar homes in the area

Home Values in the Area

Source: Public Records

Average Home Value in this Area


Source: Public Records

Purchase History

Date Buyer Sale Price Title Company
Buggs Debra J $329,000 Milestone Title Llc
Jordan Derrick R $145,000 --
Source: Public Records

Mortgage History

Date Status Borrower Loan Amount
Open Buggs Debra J $323,040
Source: Public Records

Property History

Date Event Price List to Sale Price per Sq Ft Prior Sale
02/27/2015 02/27/15 Sold $329,000 -9.8% $131 / Sq Ft View Prior Sale
01/16/2015 01/16/15 Pending -- -- --
11/17/2014 11/17/14 For Sale $364,900 +10.9% $146 / Sq Ft
11/01/2014 11/01/14 Off Market $329,000 -- --
09/04/2014 09/04/14 For Sale $364,900 +10.9% $146 / Sq Ft
08/28/2014 08/28/14 Off Market $329,000 -- --
07/07/2014 07/07/14 Pending -- -- --
06/19/2014 06/19/14 For Sale $364,900 -- $146 / Sq Ft

Tax History Compared to Growth

Source: Public Records

Tax History

Year Tax Paid Tax Assessment Tax Assessment Total Assessment is a certain percentage of the fair market value that is determined by local assessors to be the total taxable value of land and additions on the property. Land Improvement
2025 $5,512 $442,100 $102,200 $339,900
2024 $5,512 $415,067 $0 $0
2023 $5,289 $388,033 $0 $0
2022 $5,015 $361,000 $102,200 $258,800
2021 $4,790 $342,800 $0 $0
2020 $4,675 $324,600 $0 $0
2019 $4,533 $306,400 $101,100 $205,300
2018 $4,364 $287,400 $0 $0
2017 $4,221 $268,400 $0 $0
2016 -- $249,400 $0 $0
2015 $3,456 $249,400 $0 $0
2014 $3,456 $249,400 $0 $0
Source: Public Records

Agents Affiliated with this Home

  • Section Image
See All Agents

Map