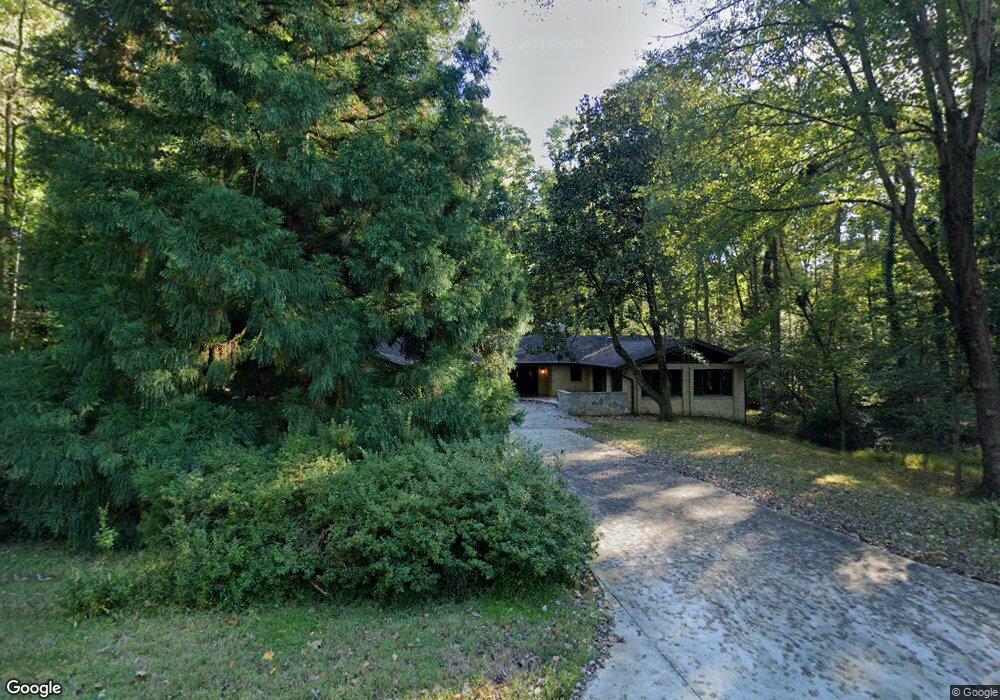
12009 Canter Ln Reston, VA 20191
Estimated Value: $1,067,000 - $1,117,000
3
Beds
2
Baths
3,517
Sq Ft
$308/Sq Ft
Est. Value
About This Home
This home is located at 12009 Canter Ln, Reston, VA 20191 and is currently estimated at $1,082,884, approximately $307 per square foot. 12009 Canter Ln is a home located in Fairfax County with nearby schools including Hunters Woods Elementary, Langston Hughes Middle School, and South Lakes High School.
Ownership History
Date
Name
Owned For
Owner Type
Purchase Details
Closed on
Mar 22, 2018
Sold by
Ehrler Dennis W and Ehrler Penny P
Bought by
Ehrler Dennis William and Ehrler Penny Perna
Current Estimated Value
Purchase Details
Closed on
Jun 17, 1998
Sold by
Kovach David S
Bought by
Ehrler Dennis W
Home Financials for this Owner
Home Financials are based on the most recent Mortgage that was taken out on this home.
Original Mortgage
$227,000
Outstanding Balance
$45,571
Interest Rate
7.09%
Estimated Equity
$1,037,313
Purchase Details
Closed on
Jan 31, 1996
Sold by
Olkin Raymond J
Bought by
Kovach David S
Home Financials for this Owner
Home Financials are based on the most recent Mortgage that was taken out on this home.
Original Mortgage
$207,000
Interest Rate
7.25%
Create a Home Valuation Report for This Property
The Home Valuation Report is an in-depth analysis detailing your home's value as well as a comparison with similar homes in the area
Home Values in the Area
Average Home Value in this Area
Purchase History
| Date | Buyer | Sale Price | Title Company |
|---|---|---|---|
| Ehrler Dennis William | -- | None Available | |
| Ehrler Dennis W | $320,000 | -- | |
| Kovach David S | $278,500 | -- |
Source: Public Records
Mortgage History
| Date | Status | Borrower | Loan Amount |
|---|---|---|---|
| Open | Kovach David S | $227,000 | |
| Previous Owner | Kovach David S | $207,000 |
Source: Public Records
Tax History
| Year | Tax Paid | Tax Assessment Tax Assessment Total Assessment is a certain percentage of the fair market value that is determined by local assessors to be the total taxable value of land and additions on the property. | Land | Improvement |
|---|---|---|---|---|
| 2025 | $10,915 | $992,120 | $431,000 | $561,120 |
| 2024 | $10,915 | $905,410 | $411,000 | $494,410 |
| 2023 | $10,728 | $912,640 | $411,000 | $501,640 |
| 2022 | $9,845 | $826,950 | $381,000 | $445,950 |
| 2021 | $9,509 | $779,090 | $341,000 | $438,090 |
| 2020 | $8,668 | $704,390 | $291,000 | $413,390 |
| 2019 | $8,668 | $704,390 | $291,000 | $413,390 |
| 2018 | $7,928 | $689,390 | $276,000 | $413,390 |
| 2017 | $7,834 | $648,490 | $251,000 | $397,490 |
| 2016 | $8,190 | $679,390 | $251,000 | $428,390 |
Source: Public Records
Map
Nearby Homes
- 2615 Steeplechase Dr
- 11713 Stillbrook Ct
- 11612 Clipstone Ln
- 2502 Woodcutter Ct
- 11833 Shire Ct Unit 11B
- 2345 Millennium Ln
- 11603 Virgate Ln
- 11812 Breton Ct Unit 21D
- 11820 Breton Ct Unit 12B
- 2396 Branleigh Park Ct
- 2356 Branleigh Park Ct
- 2233 Lovedale Ln Unit L
- 2233 Lovedale Ln Unit I
- 2224 Springwood Dr Unit J
- 2317 Freetown Ct Unit 11C
- 2216 Castle Rock Square Unit 12C
- 2225 Lovedale Ln Unit 303E
- 11637 Stoneview Square Unit 2B
- 2221 Lovedale Ln Unit 202B
- 11922 Barrel Cooper Ct
- 12007 Canter Ln
- 12013 Canter Ln
- 2603 Oldwick Ct
- 12005 Canter Ln
- 12008 Canter Ln
- 12006 Canter Ln
- 12010 Canter Ln
- 2606 Deerdell Ln
- 12004 Canter Ln
- 2601 Deerdell Ln
- 2605 Oldwick Ct
- 12012 Canter Ln
- 12014 Canter Ln
- 2605 Deerdell Ln
- 12015 Canter Ln
- 2604 Oldwick Ct
- 12002 Turf Ln
- 2602 Oldwick Ct
- 12009 Turf Ln
- 2601 Steeplechase Dr
Your Personal Tour Guide
Ask me questions while you tour the home.