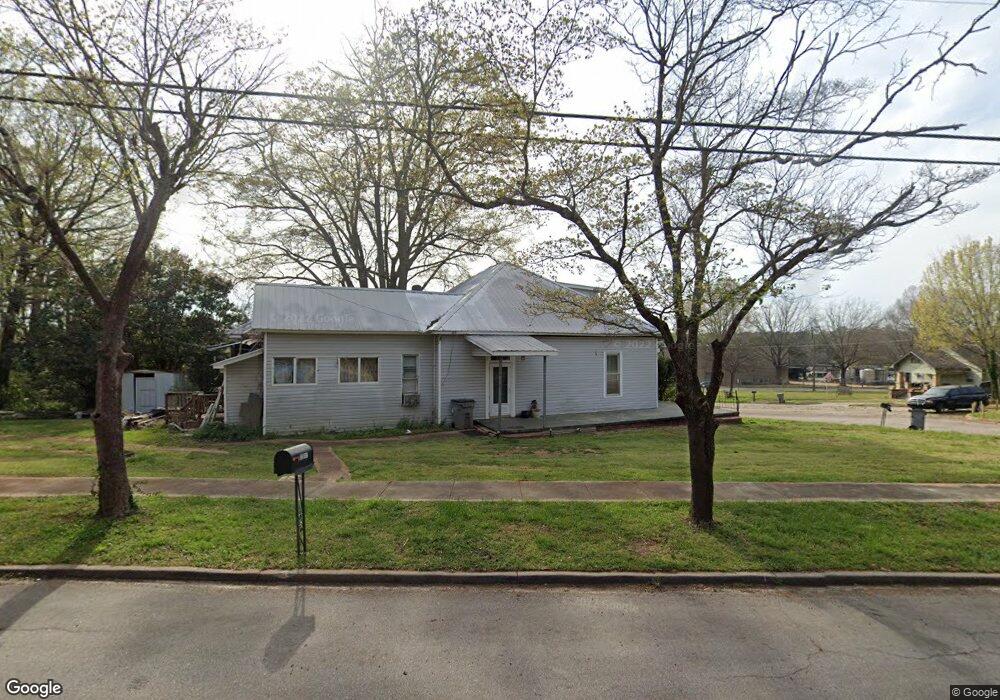
1201 1st Ave Lagrange, GA 30240
Estimated Value: $102,000 - $260,000
4
Beds
3
Baths
2,059
Sq Ft
$81/Sq Ft
Est. Value
About This Home
This home is located at 1201 1st Ave, Lagrange, GA 30240 and is currently estimated at $167,667, approximately $81 per square foot. 1201 1st Ave is a home located in Troup County with nearby schools including Berta Weathersbee Elementary School, Whitesville Road Elementary School, and Rosemont Elementary School.
Ownership History
Date
Name
Owned For
Owner Type
Purchase Details
Closed on
Jul 1, 2002
Sold by
Stephen C King
Bought by
Howard Loise T
Current Estimated Value
Purchase Details
Closed on
Dec 29, 1993
Sold by
Blackstone J
Bought by
Stephen C King
Purchase Details
Closed on
Nov 1, 1989
Sold by
Thompson Joel
Bought by
Blackstone J
Purchase Details
Closed on
Sep 26, 1988
Sold by
Bryan B L
Bought by
Thompson Joel
Purchase Details
Closed on
Aug 27, 1981
Sold by
Moore Charles L and Robbie Lynn
Bought by
Bryan B L
Purchase Details
Closed on
Sep 11, 1980
Sold by
Hester Wayne
Bought by
Moore Charles L and Robbie Lynn
Purchase Details
Closed on
May 8, 1975
Sold by
Turner Elizabeth
Bought by
Hester Wayne
Purchase Details
Closed on
Jan 1, 1972
Sold by
Dobbs Julian P
Bought by
Turner Elizabeth
Purchase Details
Closed on
Mar 1, 1969
Sold by
Bledsoe Mildred C
Bought by
Dobbs Julian P
Create a Home Valuation Report for This Property
The Home Valuation Report is an in-depth analysis detailing your home's value as well as a comparison with similar homes in the area
Purchase History
| Date | Buyer | Sale Price | Title Company |
|---|---|---|---|
| Howard Loise T | $59,200 | -- | |
| Stephen C King | $42,000 | -- | |
| Blackstone J | -- | -- | |
| Thompson Joel | $37,000 | -- | |
| Bryan B L | $24,000 | -- | |
| Moore Charles L | $22,000 | -- | |
| Hester Wayne | $11,000 | -- | |
| Turner Elizabeth | $7,900 | -- | |
| Dobbs Julian P | -- | -- |
Source: Public Records
Tax History
| Year | Tax Paid | Tax Assessment Tax Assessment Total Assessment is a certain percentage of the fair market value that is determined by local assessors to be the total taxable value of land and additions on the property. | Land | Improvement |
|---|---|---|---|---|
| 2025 | $980 | $35,920 | $5,000 | $30,920 |
| 2024 | $933 | $34,200 | $5,000 | $29,200 |
| 2023 | $913 | $33,480 | $5,000 | $28,480 |
| 2022 | $996 | $35,680 | $5,000 | $30,680 |
| 2021 | $711 | $23,560 | $5,000 | $18,560 |
| 2020 | $711 | $23,560 | $5,000 | $18,560 |
| 2019 | $679 | $22,520 | $5,000 | $17,520 |
| 2018 | $683 | $22,650 | $5,130 | $17,520 |
| 2017 | $683 | $22,650 | $5,130 | $17,520 |
| 2016 | $680 | $22,540 | $5,130 | $17,410 |
| 2015 | $678 | $22,431 | $5,021 | $17,410 |
| 2014 | $651 | $21,514 | $5,021 | $16,494 |
| 2013 | -- | $22,678 | $5,021 | $17,658 |
Source: Public Records
Map
Nearby Homes
- 1304 Forrest Ave
- 1405 Forrest Ave
- 1402 Forrest Ave
- 613 S Lee St
- 1308 Forrest Ave
- 109 Garfield St
- 1015 Stonewall St
- 1017 Stonewall St
- 606 S Lee St
- 812 Elm St
- 517 Jefferson St
- 900 B N Pkwy
- 1520 Brownwood Ave
- 202 Parker Ln
- 1205 Park Ave
- 606 Poplar St
- 1308 Park Ave
- 507 S Lee St
- 1808 Murphy Ave
- 1311 Juniper St
Your Personal Tour Guide
Ask me questions while you tour the home.