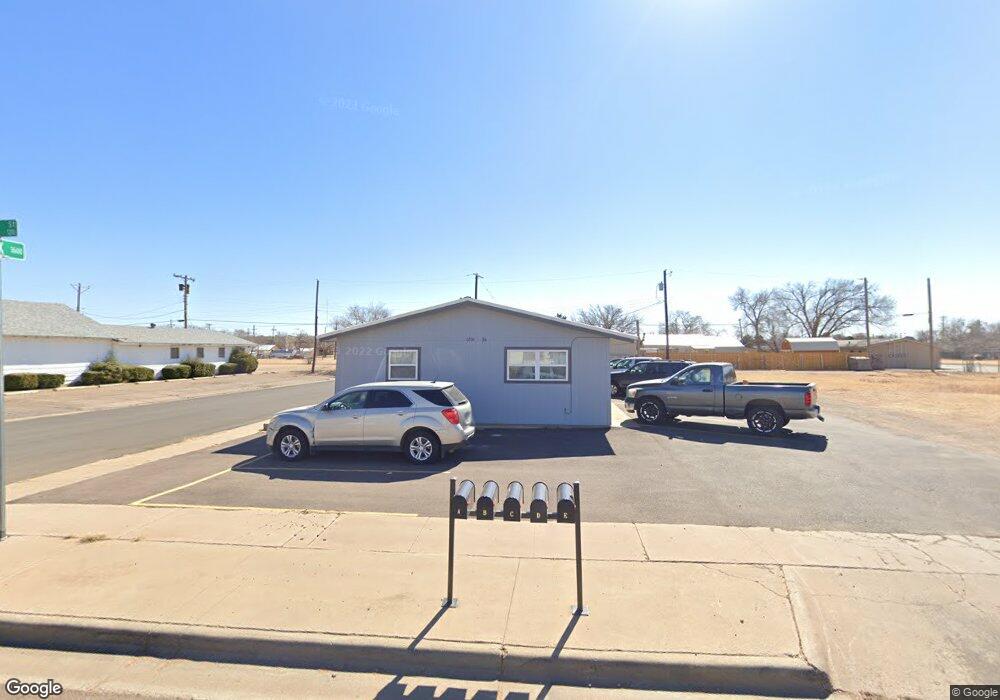
1201 36th St Unit E Lubbock, TX 79412
Ballenger NeighborhoodEstimated Value: $147,000 - $580,000
1
Bed
1
Bath
540
Sq Ft
$673/Sq Ft
Est. Value
About This Home
This home is located at 1201 36th St Unit E, Lubbock, TX 79412 and is currently estimated at $363,500, approximately $673 per square foot. 1201 36th St Unit E is a home located in Lubbock County with nearby schools including Bean Elementary School, Slaton Middle School, and Monterey High School.
Ownership History
Date
Name
Owned For
Owner Type
Purchase Details
Closed on
May 9, 2024
Sold by
Hinkle Colby and Hinkle Chelsea
Bought by
Chinkle2 Trust and Hinkle
Current Estimated Value
Purchase Details
Closed on
Jul 10, 2020
Sold by
The Texas District Agency Llc
Bought by
Berlanga Oscar
Purchase Details
Closed on
Jul 9, 2020
Sold by
Berlanga Oscar
Bought by
Hinkle Colby
Purchase Details
Closed on
Jun 24, 2010
Sold by
Hub City Properties Llc
Bought by
The Texas District Agency Llc
Purchase Details
Closed on
Nov 7, 2006
Sold by
Brown David
Bought by
Hub City Properties Llc
Home Financials for this Owner
Home Financials are based on the most recent Mortgage that was taken out on this home.
Original Mortgage
$52,000
Interest Rate
6.28%
Mortgage Type
Commercial
Purchase Details
Closed on
Nov 8, 1994
Bought by
Texas District Agency Llc
Create a Home Valuation Report for This Property
The Home Valuation Report is an in-depth analysis detailing your home's value as well as a comparison with similar homes in the area
Home Values in the Area
Average Home Value in this Area
Purchase History
| Date | Buyer | Sale Price | Title Company |
|---|---|---|---|
| Chinkle2 Trust | -- | None Listed On Document | |
| Berlanga Oscar | -- | Hub City Title | |
| Hinkle Colby | -- | Hub City Title | |
| The Texas District Agency Llc | -- | Service Title Company | |
| Hub City Properties Llc | -- | Stl | |
| Texas District Agency Llc | -- | -- |
Source: Public Records
Mortgage History
| Date | Status | Borrower | Loan Amount |
|---|---|---|---|
| Previous Owner | Hub City Properties Llc | $52,000 |
Source: Public Records
Tax History
| Year | Tax Paid | Tax Assessment Tax Assessment Total Assessment is a certain percentage of the fair market value that is determined by local assessors to be the total taxable value of land and additions on the property. | Land | Improvement |
|---|---|---|---|---|
| 2025 | $2,270 | $107,000 | $6,457 | $100,543 |
| 2024 | $23 | $125,000 | $6,457 | $118,543 |
| 2023 | $2,415 | $129,901 | $6,457 | $123,444 |
| 2022 | $2,452 | $121,133 | $6,457 | $114,676 |
| 2021 | $605 | $28,230 | $6,457 | $21,773 |
| 2020 | $490 | $22,538 | $6,457 | $16,081 |
| 2019 | $506 | $22,538 | $6,457 | $16,081 |
| 2018 | $504 | $22,422 | $6,457 | $15,965 |
| 2017 | $1,462 | $64,956 | $6,457 | $58,499 |
| 2016 | $1,427 | $63,391 | $6,457 | $56,934 |
| 2015 | $1,410 | $63,391 | $6,457 | $56,934 |
| 2014 | $1,410 | $63,391 | $6,457 | $56,934 |
Source: Public Records
Map
Nearby Homes
- 1201 36th St Unit B
- 1201 36th St Unit D
- 1201 36th St Unit C
- 1201 36th St Unit A
- 1201 36th St
- 1202 37th St
- 1204 37th St
- 1202 36th St
- 1204 36th St Unit B
- 1204 36th St Unit A
- 1204 36th St
- 1218 37th St
- 1112 36th St
- 1110 36th St
- 1103 36th St
- 1108 36th St
- 1106 36th St
- 3716 Avenue K
- 1203 37th St
- 3602 Avenue J
Your Personal Tour Guide
Ask me questions while you tour the home.