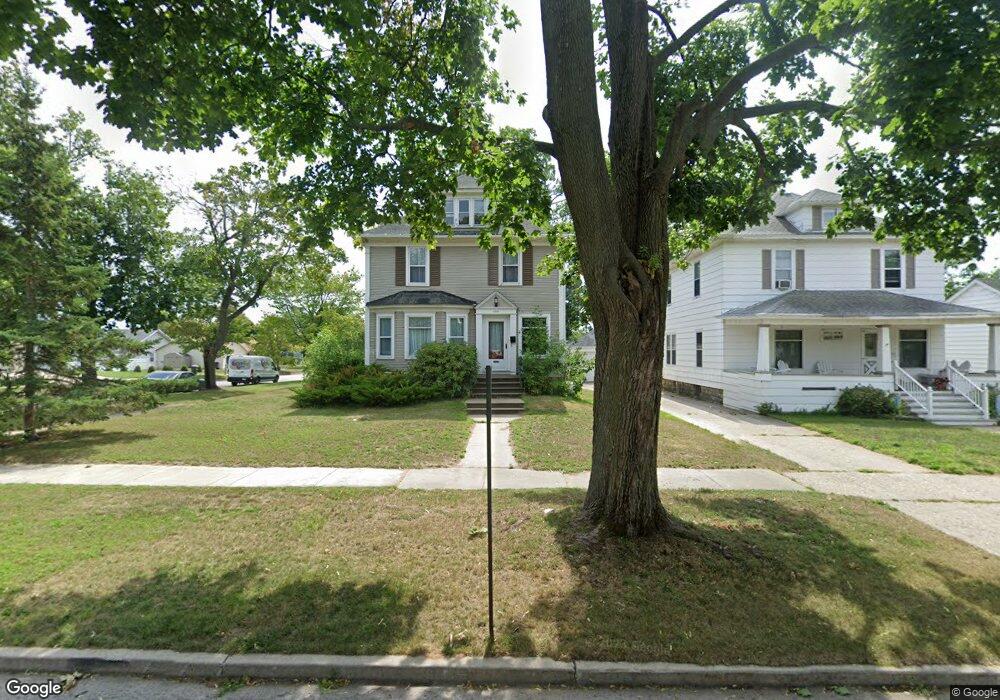
1201 8th Ave S Escanaba, MI 49829
Estimated Value: $138,000 - $211,328
4
Beds
2
Baths
1,630
Sq Ft
$112/Sq Ft
Est. Value
About This Home
This home is located at 1201 8th Ave S, Escanaba, MI 49829 and is currently estimated at $181,832, approximately $111 per square foot. 1201 8th Ave S is a home located in Delta County with nearby schools including Escanaba Jr./Sr. High School, Holy Name Catholic School, and Escanaba Sda School.
Ownership History
Date
Name
Owned For
Owner Type
Purchase Details
Closed on
Sep 30, 2021
Sold by
Mullins Kenneth
Bought by
Diment Morley and Diment Christina
Current Estimated Value
Purchase Details
Closed on
Oct 29, 2011
Sold by
Campbell Dewayne and Gerou Vicki Lynn
Bought by
Mullins Kenneth and Kincaid Judy
Home Financials for this Owner
Home Financials are based on the most recent Mortgage that was taken out on this home.
Original Mortgage
$79,112
Interest Rate
4.02%
Purchase Details
Closed on
Oct 6, 1975
Bought by
Campbell
Create a Home Valuation Report for This Property
The Home Valuation Report is an in-depth analysis detailing your home's value as well as a comparison with similar homes in the area
Home Values in the Area
Average Home Value in this Area
Purchase History
| Date | Buyer | Sale Price | Title Company |
|---|---|---|---|
| Diment Morley | $95,000 | -- | |
| Mullins Kenneth | -- | -- | |
| Campbell | -- | -- |
Source: Public Records
Mortgage History
| Date | Status | Borrower | Loan Amount |
|---|---|---|---|
| Previous Owner | Mullins Kenneth | $79,112 |
Source: Public Records
Tax History Compared to Growth
Tax History
| Year | Tax Paid | Tax Assessment Tax Assessment Total Assessment is a certain percentage of the fair market value that is determined by local assessors to be the total taxable value of land and additions on the property. | Land | Improvement |
|---|---|---|---|---|
| 2025 | $3,771 | $82,500 | $0 | $0 |
| 2024 | $2,003 | $73,600 | $0 | $0 |
| 2023 | $1,910 | $66,500 | $0 | $0 |
| 2022 | $3,482 | $57,500 | $0 | $0 |
| 2021 | $3,508 | $54,400 | $0 | $0 |
| 2020 | $3,138 | $57,100 | $0 | $0 |
| 2019 | $3,051 | $52,800 | $0 | $0 |
| 2018 | $2,077 | $54,900 | $0 | $0 |
| 2017 | $1,517 | $54,905 | $0 | $0 |
| 2016 | $1,992 | $54,646 | $0 | $0 |
| 2014 | $1,452 | $51,216 | $0 | $0 |
| 2013 | $1,452 | $50,530 | $0 | $0 |
Source: Public Records
Map
Nearby Homes