Estimated Value: $516,393 - $787,000
3
Beds
2
Baths
1,968
Sq Ft
$302/Sq Ft
Est. Value
About This Home
This home is located at 1201 E Vine Maple Ln, Union, WA 98592 and is currently estimated at $594,598, approximately $302 per square foot. 1201 E Vine Maple Ln is a home located in Mason County with nearby schools including Hood Canal Elementary/Junior High School.
Ownership History
Date
Name
Owned For
Owner Type
Purchase Details
Closed on
Sep 30, 2013
Sold by
Price Douglas W and Price Nany
Bought by
Dickinson Denise M
Current Estimated Value
Home Financials for this Owner
Home Financials are based on the most recent Mortgage that was taken out on this home.
Original Mortgage
$188,000
Outstanding Balance
$141,651
Interest Rate
4.57%
Mortgage Type
New Conventional
Estimated Equity
$452,947
Purchase Details
Closed on
Aug 19, 2011
Sold by
Jaeger Ventures Llc
Bought by
Price Douglas W
Purchase Details
Closed on
Sep 26, 2006
Sold by
Price Douglas W
Bought by
Jaeger Ventures Llc
Purchase Details
Closed on
Nov 23, 2005
Sold by
Steli Reid
Bought by
Price Douglas W
Home Financials for this Owner
Home Financials are based on the most recent Mortgage that was taken out on this home.
Original Mortgage
$137,600
Interest Rate
5.9%
Mortgage Type
Assumption
Purchase Details
Closed on
Mar 21, 2005
Sold by
Wood Susan E
Bought by
Reid Stell and Estate Of Eileen P Stell
Create a Home Valuation Report for This Property
The Home Valuation Report is an in-depth analysis detailing your home's value as well as a comparison with similar homes in the area
Purchase History
| Date | Buyer | Sale Price | Title Company |
|---|---|---|---|
| Dickinson Denise M | $275,000 | Mason County Title Ins Co | |
| Price Douglas W | -- | None Available | |
| Jaeger Ventures Llc | -- | None Available | |
| Price Douglas W | $172,000 | Land Title Co | |
| Reid Stell | -- | None Available |
Source: Public Records
Mortgage History
| Date | Status | Borrower | Loan Amount |
|---|---|---|---|
| Open | Dickinson Denise M | $188,000 | |
| Previous Owner | Price Douglas W | $137,600 |
Source: Public Records
Tax History
| Year | Tax Paid | Tax Assessment Tax Assessment Total Assessment is a certain percentage of the fair market value that is determined by local assessors to be the total taxable value of land and additions on the property. | Land | Improvement |
|---|---|---|---|---|
| 2025 | $3,096 | $492,460 | $52,460 | $440,000 |
| 2024 | $3,096 | $483,795 | $49,030 | $434,765 |
| 2023 | $3,095 | $428,045 | $31,630 | $396,415 |
| 2022 | $3,297 | $357,280 | $22,275 | $335,005 |
| 2021 | $3,192 | $357,280 | $22,275 | $335,005 |
| 2020 | $3,385 | $309,630 | $20,250 | $289,380 |
| 2018 | $2,434 | $229,730 | $44,225 | $185,505 |
| 2017 | $2,364 | $229,880 | $44,375 | $185,505 |
| 2016 | $2,423 | $234,020 | $42,040 | $191,980 |
| 2015 | -- | $246,010 | $44,375 | $201,635 |
| 2014 | -- | $248,345 | $46,710 | $201,635 |
| 2013 | -- | $312,445 | $80,000 | $232,445 |
Source: Public Records
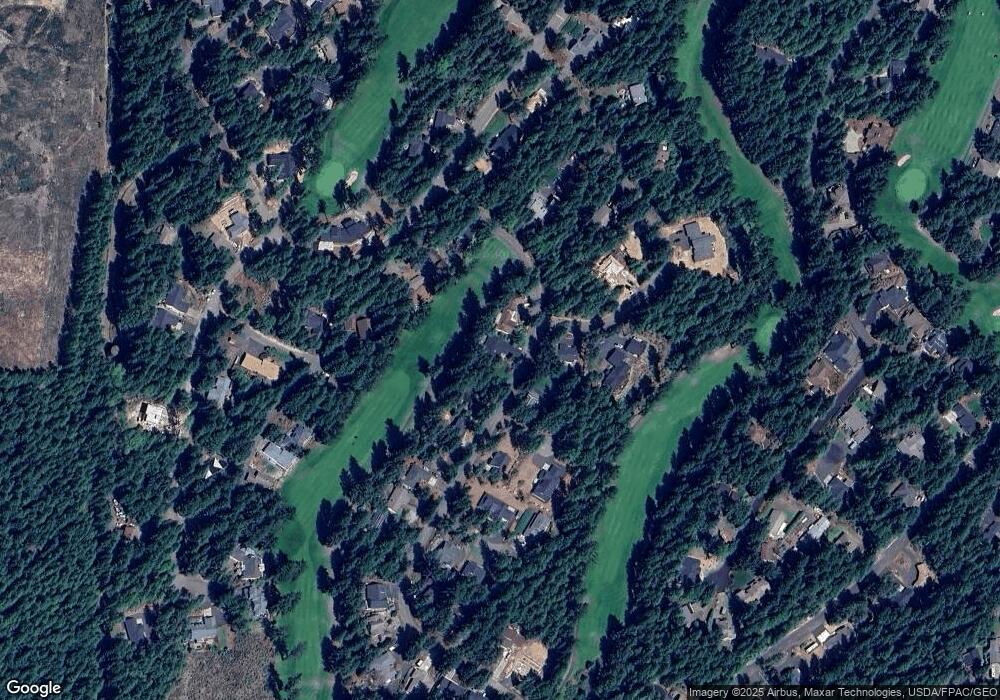
Map
Nearby Homes
- 1250 E Vine Maple Ln
- 121 E Fir Tree Ln
- 100 E Fir Tree Ln
- 110 E Rhododendron Ln
- 40 E Paint Brush Ln
- 700 E Vine Maple Ln
- 31 E Rhododendron Ct
- 50 E Laurel Park
- 30 E Hemlock Ln
- 91 E Jack Pine Ln
- 350 E Vine Maple Ln
- 71 E Hemlock Ct
- 280 E Laurel Park
- 161 E Hemlock Ln
- 1031 E Manzanita Dr
- 1190 E Manzanita Dr
- 121 E Country Club Dr E
- 50 E Eastwood Ln
- 21 E Eastwood Ln
- 33 E Michelle Ct
- 1221 E Vine Maple Ln
- 1171 E Vine Maple Ln
- 1190 E Vine Maple Ln
- 201 E Dogwood Ln
- 71 E Vine Maple Ln
- 1161 E Vine Maple Ln
- 190 E Dogwood Ln
- 1150 E Vine Maple Ln
- 1291 E Vine Maple Ln
- 321 E Jack Pine Ln
- 1141 E Vine Maple Ln
- 181 E Dogwood Ln
- 150 E Dogwood Ln
- 71 E Fir Tree Ln
- 20 E Dogwood Ln
- 61 E Fir Tree Ln
- 1131 E Vine Maple Ln
- 341 E Jack Pine Ln
- 21 E Vine Maple Ct
- 100 E Dogwood Ln
Your Personal Tour Guide
Ask me questions while you tour the home.