Estimated Value: $109,038 - $139,000
1
Bed
2
Baths
1,013
Sq Ft
$122/Sq Ft
Est. Value
About This Home
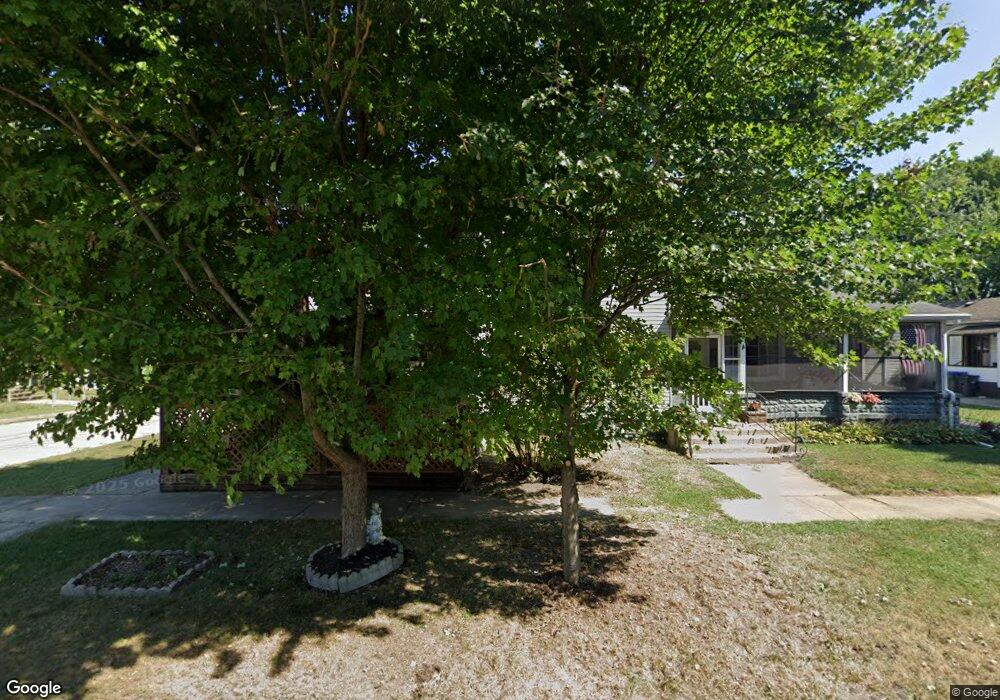
This home is located at 1201 Ferry St, Niles, MI 49120 and is currently estimated at $123,760, approximately $122 per square foot. 1201 Ferry St is a home located in Berrien County with nearby schools including Ballard Elementary School, Ring Lardner Middle School, and Oak Manor Sixth Grade Center.
Ownership History
Date
Name
Owned For
Owner Type
Purchase Details
Closed on
May 4, 2006
Sold by
Estate Of Nevada Rossow
Bought by
George Mable Jean and George Charlin
Current Estimated Value
Home Financials for this Owner
Home Financials are based on the most recent Mortgage that was taken out on this home.
Original Mortgage
$2,078
Outstanding Balance
$1,244
Interest Rate
7%
Mortgage Type
New Conventional
Estimated Equity
$122,516
Purchase Details
Closed on
Jun 20, 1994
Purchase Details
Closed on
Jun 16, 1994
Purchase Details
Closed on
Jun 1, 1993
Purchase Details
Closed on
Aug 10, 1992
Purchase Details
Closed on
Feb 13, 1989
Create a Home Valuation Report for This Property
The Home Valuation Report is an in-depth analysis detailing your home's value as well as a comparison with similar homes in the area
Home Values in the Area
Average Home Value in this Area
Purchase History
| Date | Buyer | Sale Price | Title Company |
|---|---|---|---|
| George Mable Jean | -- | None Available | |
| -- | $4,500 | -- | |
| -- | $100 | -- | |
| -- | $100 | -- | |
| -- | -- | -- | |
| -- | -- | -- |
Source: Public Records
Mortgage History
| Date | Status | Borrower | Loan Amount |
|---|---|---|---|
| Open | George Mable Jean | $2,078 |
Source: Public Records
Tax History Compared to Growth
Tax History
| Year | Tax Paid | Tax Assessment Tax Assessment Total Assessment is a certain percentage of the fair market value that is determined by local assessors to be the total taxable value of land and additions on the property. | Land | Improvement |
|---|---|---|---|---|
| 2025 | $754 | $44,100 | $0 | $0 |
| 2024 | $576 | $39,700 | $0 | $0 |
| 2023 | $552 | $31,600 | $0 | $0 |
| 2022 | $526 | $24,600 | $0 | $0 |
| 2021 | $655 | $23,100 | $800 | $22,300 |
| 2020 | $648 | $21,900 | $0 | $0 |
| 2019 | $641 | $19,400 | $600 | $18,800 |
| 2018 | $620 | $19,400 | $0 | $0 |
| 2017 | $610 | $19,700 | $0 | $0 |
| 2016 | $597 | $19,500 | $0 | $0 |
| 2015 | $595 | $18,700 | $0 | $0 |
| 2014 | $457 | $18,000 | $0 | $0 |
Source: Public Records
Map
Nearby Homes