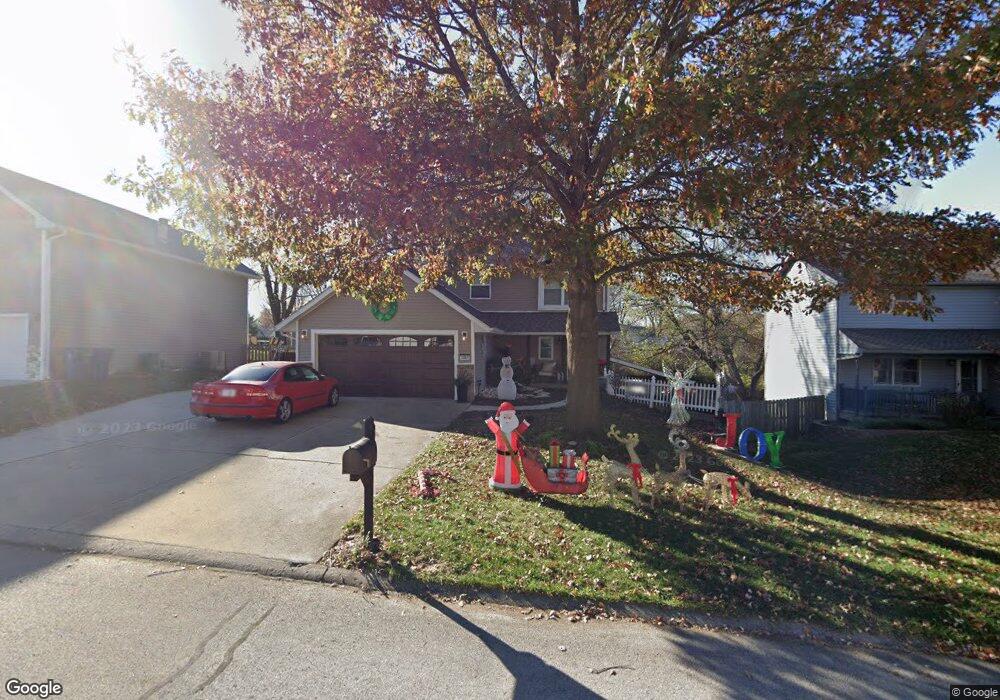
1201 Jacquelyn Ct Maryville, IL 62062
Estimated Value: $256,853 - $279,000
1
Bed
2
Baths
702
Sq Ft
$385/Sq Ft
Est. Value
About This Home
This home is located at 1201 Jacquelyn Ct, Maryville, IL 62062 and is currently estimated at $270,463, approximately $385 per square foot. 1201 Jacquelyn Ct is a home located in Madison County with nearby schools including Maryville Elementary School, Dorris Intermediate School, and Collinsville Middle School.
Ownership History
Date
Name
Owned For
Owner Type
Purchase Details
Closed on
May 14, 2019
Sold by
Romani Allyson M
Bought by
Yates Brian and Yates Allyson M
Current Estimated Value
Purchase Details
Closed on
Jul 14, 2007
Sold by
Harbison Damon R and Harbison Michelle E
Bought by
Romani Allyson M
Home Financials for this Owner
Home Financials are based on the most recent Mortgage that was taken out on this home.
Original Mortgage
$173,500
Interest Rate
6.54%
Mortgage Type
Purchase Money Mortgage
Purchase Details
Closed on
Apr 16, 2004
Sold by
Fournie Kevin Dwayne and Fournie Heather Doreen
Bought by
Harbison Damon R and Harbison Michelle E
Home Financials for this Owner
Home Financials are based on the most recent Mortgage that was taken out on this home.
Original Mortgage
$113,600
Interest Rate
5.48%
Mortgage Type
Purchase Money Mortgage
Create a Home Valuation Report for This Property
The Home Valuation Report is an in-depth analysis detailing your home's value as well as a comparison with similar homes in the area
Home Values in the Area
Average Home Value in this Area
Purchase History
| Date | Buyer | Sale Price | Title Company |
|---|---|---|---|
| Yates Brian | -- | Benchmark Title | |
| Romani Allyson M | $173,500 | Abstracts & Titles Inc | |
| Harbison Damon R | $142,000 | Abstracts & Titles Inc |
Source: Public Records
Mortgage History
| Date | Status | Borrower | Loan Amount |
|---|---|---|---|
| Previous Owner | Romani Allyson M | $173,500 | |
| Previous Owner | Harbison Damon R | $113,600 | |
| Closed | Harbison Damon R | $21,300 |
Source: Public Records
Tax History Compared to Growth
Tax History
| Year | Tax Paid | Tax Assessment Tax Assessment Total Assessment is a certain percentage of the fair market value that is determined by local assessors to be the total taxable value of land and additions on the property. | Land | Improvement |
|---|---|---|---|---|
| 2024 | $4,979 | $76,050 | $7,330 | $68,720 |
| 2023 | $4,979 | $69,210 | $6,660 | $62,550 |
| 2022 | $4,620 | $64,000 | $6,160 | $57,840 |
| 2021 | $4,185 | $60,130 | $5,790 | $54,340 |
| 2020 | $4,043 | $57,370 | $5,520 | $51,850 |
| 2019 | $2,716 | $44,240 | $5,580 | $38,660 |
| 2018 | $2,641 | $41,920 | $5,290 | $36,630 |
| 2017 | $2,579 | $41,080 | $5,180 | $35,900 |
| 2016 | $2,619 | $41,080 | $5,180 | $35,900 |
| 2015 | $2,487 | $40,020 | $5,050 | $34,970 |
| 2014 | $2,487 | $40,020 | $5,050 | $34,970 |
| 2013 | $2,487 | $40,020 | $5,050 | $34,970 |
Source: Public Records
Map
Nearby Homes
- 1313 Jacquelyn Ct
- 501 Drost St
- 29 Dogwood Terrace
- 53 Cheshire Dr
- 419 N Donk Ave
- 14 Lou Juan Dr
- 137 W Zupan St
- 1005 Daniel Dr
- 1014 Daniel Dr
- 24 Alta St
- 1029 Andra Dr
- 505 Huntington
- 912 Oakridge Dr
- 201 S Lange Ave
- 126 Kingsbrooke Blvd
- 241 Madison Ave
- 5 Chariot Ct
- 0 Route 159
- 2301 Preswyck Ct
- 109 Kingsbrooke Blvd
- 1207 Jacquelyn Ct
- 1113 Jacquelyn Ct
- 1213 Jacquelyn Ct
- 1107 Jacquelyn Ct
- 1219 Jacquelyn Ct
- 1101 Jacquelyn Ct
- 1208 Jacquelyn Ct
- 1118 Jacquelyn Ct
- 1104 Saddlewood Dr
- 1112 Jacquelyn Ct
- 1212 Jacquelyn Ct
- 1301 Jacquelyn Ct
- 1214 Jacquelyn Ct
- 1106 Jacquelyn Ct
- 1013 Jacquelyn Ct
- 1300 Jacquelyn Ct
- 1100 Jacquelyn Ct
- 1307 Jacquelyn Ct
- 1112 Saddlewood Dr
- 1010 Jacquelyn Ct