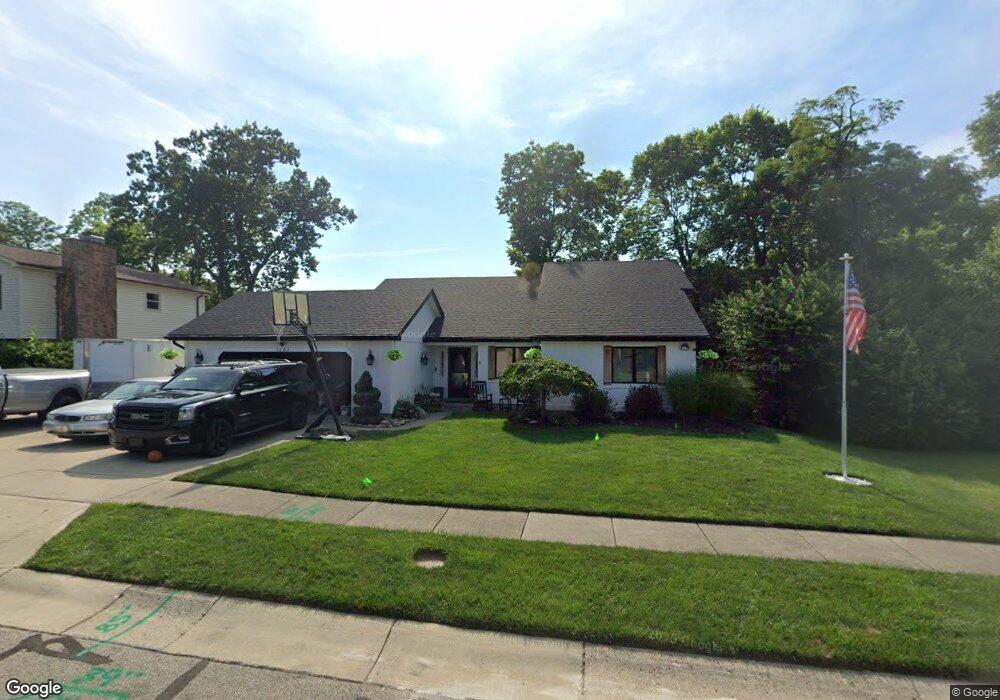
1201 Lord Fitzwalter Dr Miamisburg, OH 45342
Estimated Value: $283,000 - $311,000
3
Beds
2
Baths
1,699
Sq Ft
$174/Sq Ft
Est. Value
About This Home
This home is located at 1201 Lord Fitzwalter Dr, Miamisburg, OH 45342 and is currently estimated at $295,660, approximately $174 per square foot. 1201 Lord Fitzwalter Dr is a home located in Montgomery County with nearby schools including Miamisburg High School and Bethel Baptist School.
Ownership History
Date
Name
Owned For
Owner Type
Purchase Details
Closed on
Jun 25, 2015
Sold by
Peters Ernest L and Peters Renee M
Bought by
Baker Joshua and Baker Amanda
Current Estimated Value
Home Financials for this Owner
Home Financials are based on the most recent Mortgage that was taken out on this home.
Original Mortgage
$132,325
Outstanding Balance
$103,215
Interest Rate
3.87%
Mortgage Type
FHA
Estimated Equity
$192,445
Purchase Details
Closed on
Nov 20, 2000
Sold by
Wilson Cody L and Wilson Karen C
Bought by
Snell Joseph F and Snell Linda L
Home Financials for this Owner
Home Financials are based on the most recent Mortgage that was taken out on this home.
Original Mortgage
$54,500
Interest Rate
7.87%
Purchase Details
Closed on
Aug 31, 1998
Sold by
Evans Edward A and Evans Linda F
Bought by
Wilson Cody L and Wilson Karen C
Home Financials for this Owner
Home Financials are based on the most recent Mortgage that was taken out on this home.
Original Mortgage
$132,498
Interest Rate
7.04%
Mortgage Type
VA
Create a Home Valuation Report for This Property
The Home Valuation Report is an in-depth analysis detailing your home's value as well as a comparison with similar homes in the area
Home Values in the Area
Average Home Value in this Area
Purchase History
| Date | Buyer | Sale Price | Title Company |
|---|---|---|---|
| Baker Joshua | $137,900 | Landmark Title Agency South | |
| Snell Joseph F | $140,500 | -- | |
| Wilson Cody L | $129,900 | Lawyers Title Ins Corp | |
| Wilson Cody L | $129,900 | Lawyers Title Insurance Corp |
Source: Public Records
Mortgage History
| Date | Status | Borrower | Loan Amount |
|---|---|---|---|
| Open | Baker Joshua | $132,325 | |
| Previous Owner | Snell Joseph F | $54,500 | |
| Previous Owner | Wilson Cody L | $132,498 |
Source: Public Records
Tax History Compared to Growth
Tax History
| Year | Tax Paid | Tax Assessment Tax Assessment Total Assessment is a certain percentage of the fair market value that is determined by local assessors to be the total taxable value of land and additions on the property. | Land | Improvement |
|---|---|---|---|---|
| 2024 | $5,114 | $80,500 | $14,490 | $66,010 |
| 2023 | $5,114 | $80,500 | $14,490 | $66,010 |
| 2022 | $4,790 | $63,540 | $12,080 | $51,460 |
| 2021 | $3,953 | $59,360 | $12,080 | $47,280 |
| 2020 | $3,946 | $59,360 | $12,080 | $47,280 |
| 2019 | $3,514 | $48,490 | $10,500 | $37,990 |
| 2018 | $3,525 | $48,490 | $10,500 | $37,990 |
| 2017 | $3,501 | $48,490 | $10,500 | $37,990 |
| 2016 | $3,229 | $43,090 | $10,500 | $32,590 |
| 2015 | $2,528 | $43,090 | $10,500 | $32,590 |
| 2014 | $2,528 | $43,090 | $10,500 | $32,590 |
| 2012 | -- | $47,850 | $13,300 | $34,550 |
Source: Public Records
Map
Nearby Homes
- 1803 Cudgell Dr
- 857 Lea Castle Place
- 1109 Sundance Dr
- 429 Wilson Park Dr
- 838 Maid Marion Ct
- 2125 Sherwood Forest Dr
- 700 N Gebhart Church Rd
- 1232 Hollyhill Dr
- 1000 Skyview Dr
- 2302 King Richard Pkwy
- 703 Friar Tuck Ct
- 00 Heincke Rd
- 257 Ironwood Dr
- 308 Ironwood Dr
- 250 Grantwood Dr
- 1100 S Elm St
- 722 Peach Orchard Dr
- 1678 Carolyn Dr
- 524 N Lindsey Ave
- 1121 Dayket Cir
- 1131 Lord Fitzwalter Dr
- 1646 Hickory Glenn Dr
- 1637 Hickory Glenn Dr
- 1213 Lord Fitzwalter Dr
- 1121 Lord Fitzwalter Dr
- 1202 Lord Fitzwalter Dr
- 1208 Lord Fitzwalter Dr
- 1130 Lord Fitzwalter Dr
- 1636 Hickory Glenn Dr
- 1219 Lord Fitzwalter Dr
- 1214 Lord Fitzwalter Dr
- 1627 Hickory Glenn Dr
- 1637 Sherwood Forest Dr
- 1120 Lord Fitzwalter Dr
- 1627 Sherwood Forest Dr
- 1102 Lord Fitzwalter Dr
- 1218 Lord Fitzwalter Dr
- 1626 Hickory Glenn Dr
- 1301 Lord Fitzwalter Dr
- 1207 Kirkley Hall Dr