
Seller's Agent in 2020
Kevin Macicek
AREA Texas Realty
(713) 972-1222
1 in this area
72 Total Sales

Estimated Value: $327,132 - $396,000
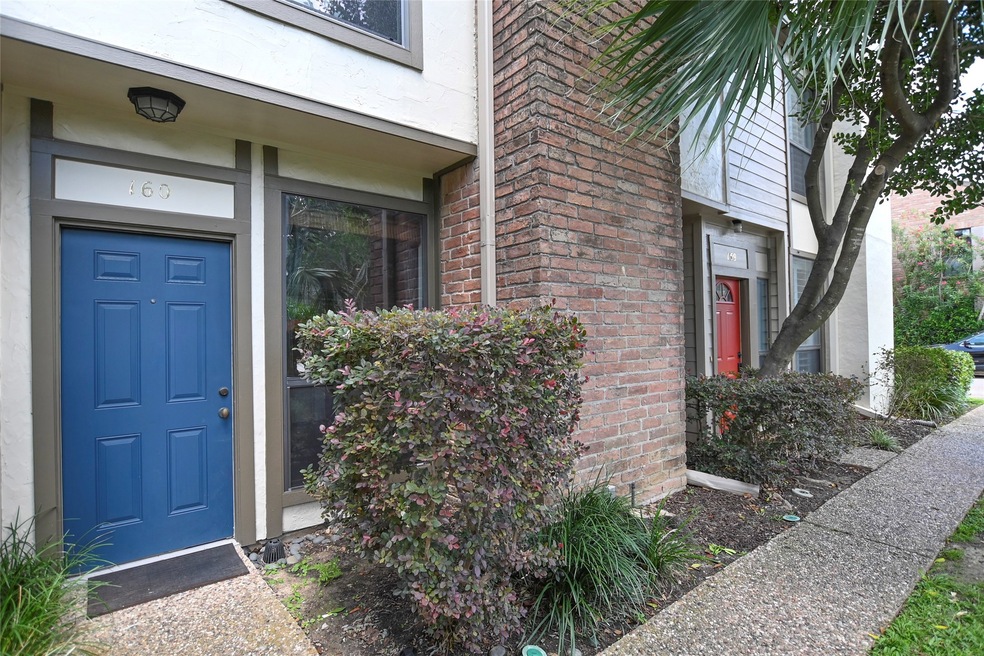
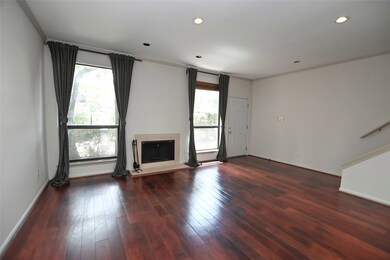
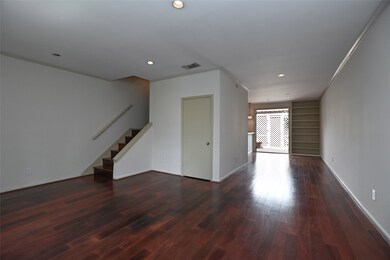
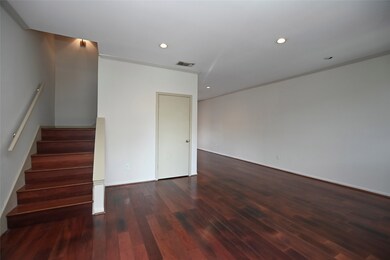
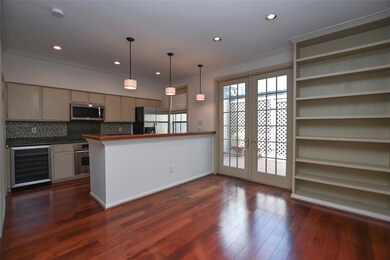
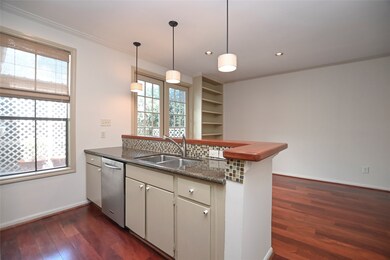
Fantastic 2-story condo in lovely, well-maintained 24-hour manned complex. Features include: Custom glass tile & wood breakfast bar, SS refrigerator, microwave, range & wine fridge, granite counters, wood burning fireplace, Pella French doors, double pane windows, amazing closet space, 2-car garage, and landscaped patio with pavers & K9 grass. Walking distance to River Oaks Shopping Center and some of Houston's best restaurants, shops and movie theatre. Refrigerator, Washer & Dryer included.
Last Agent to Sell the Property
AREA Texas Realty License #0398197 Listed on: 05/18/2020
Last Buyer's Agent
Fontaine Carroll
Fontaine Carroll Properties License #0326585
| Date | Buyer | Sale Price | Title Company |
|---|---|---|---|
| Klaes Kittsie Ann | -- | None Listed On Document | |
| So Jenny | -- | Charter Title Company | |
| So Jenny | -- | Charter Title Company | |
| Hill Laura | -- | Charter Title Company | |
| Cube D Properties Llc | -- | -- |
| Date | Status | Borrower | Loan Amount |
|---|---|---|---|
| Open | Klaes Kittsie Ann | $248,000 | |
| Previous Owner | Hill Laura | $195,886 |
| Date | Event | Price | List to Sale | Price per Sq Ft |
|---|---|---|---|---|
| 07/27/2025 07/27/25 | Off Market | -- | -- | -- |
| 08/06/2020 08/06/20 | Sold | -- | -- | -- |
| 07/07/2020 07/07/20 | Pending | -- | -- | -- |
| 05/18/2020 05/18/20 | For Sale | $320,000 | -- | $211 / Sq Ft |
| Year | Tax Paid | Tax Assessment Tax Assessment Total Assessment is a certain percentage of the fair market value that is determined by local assessors to be the total taxable value of land and additions on the property. | Land | Improvement |
|---|---|---|---|---|
| 2025 | $6,119 | $301,826 | $57,347 | $244,479 |
| 2024 | $6,119 | $292,421 | $55,560 | $236,861 |
| 2023 | $6,119 | $265,000 | $56,536 | $208,464 |
| 2022 | $6,022 | $273,508 | $54,453 | $219,055 |
| 2021 | $6,875 | $295,000 | $57,404 | $237,596 |
| 2020 | $7,404 | $305,765 | $63,142 | $242,623 |
| 2019 | $8,097 | $319,985 | $60,797 | $259,188 |
| 2018 | $6,912 | $297,000 | $61,829 | $235,171 |
| 2017 | $7,881 | $297,000 | $61,829 | $235,171 |
| 2016 | $8,453 | $318,551 | $61,829 | $256,722 |
| 2015 | $4,590 | $320,362 | $60,869 | $259,493 |
| 2014 | $4,590 | $277,458 | $52,717 | $224,741 |
Seller's Agent in 2020
Kevin Macicek
AREA Texas Realty
(713) 972-1222
1 in this area
72 Total Sales
F
Buyer's Agent in 2020
Fontaine Carroll
Fontaine Carroll Properties
Source: Houston Association of REALTORS®
MLS Number: 48554727
APN: 1143360040002
Disclaimer: Certain information contained herein is derived from information provided by parties other than Homes.com. All information provided is deemed reliable, but is not guaranteed to be accurate and should be independently verified.
![]() Copyright 2025, Houston REALTORS® Information Service, Inc.
Copyright 2025, Houston REALTORS® Information Service, Inc.
The information provided is exclusively for consumers’ personal, non-commercial use, and may not be used for any purpose other than to identify prospective properties consumers may be interested in purchasing.
Information is deemed reliable but not guaranteed.