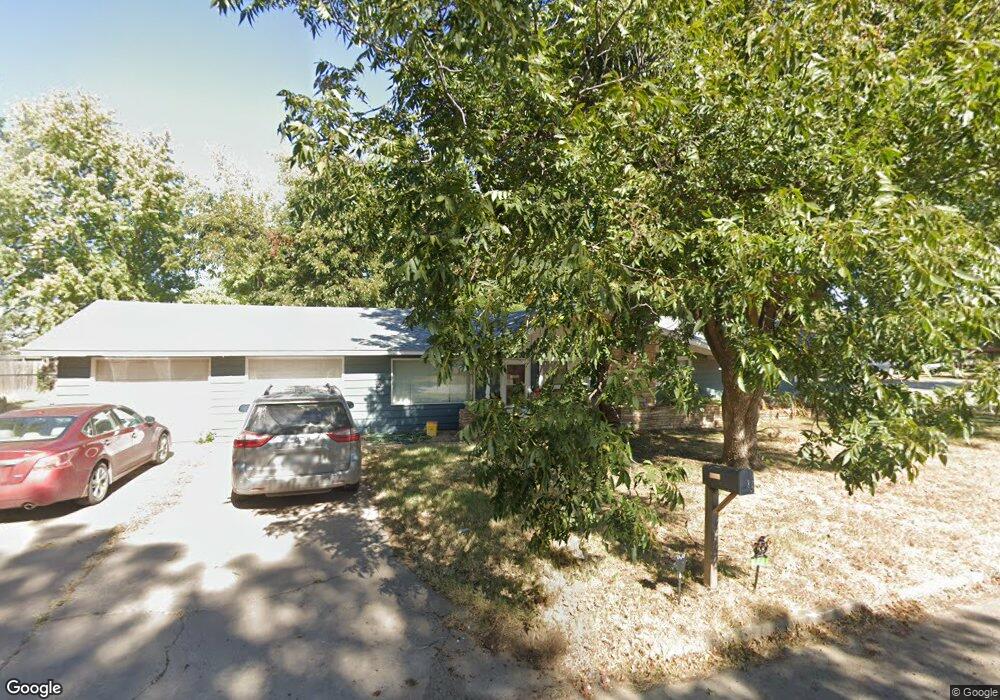
1201 N 5th St Tonkawa, OK 74653
Estimated Value: $129,000 - $145,000
3
Beds
2
Baths
1,612
Sq Ft
$86/Sq Ft
Est. Value
About This Home
This home is located at 1201 N 5th St, Tonkawa, OK 74653 and is currently estimated at $139,232, approximately $86 per square foot. 1201 N 5th St is a home located in Kay County with nearby schools including Tonkawa Elementary School, Tonkawa Middle School, and Tonkawa High School.
Ownership History
Date
Name
Owned For
Owner Type
Purchase Details
Closed on
Feb 26, 2020
Sold by
Cook Zachary Wayne and Cook Briana Jean
Bought by
Cook Zachary Wayne and Cook Briana Jean
Current Estimated Value
Purchase Details
Closed on
Aug 12, 2019
Sold by
Perkins Kristopher M and Cook Zachary Wayne
Bought by
Cook Zachary Wayne and Cook Brianna Jean
Home Financials for this Owner
Home Financials are based on the most recent Mortgage that was taken out on this home.
Original Mortgage
$81,921
Outstanding Balance
$71,748
Interest Rate
3.7%
Mortgage Type
VA
Estimated Equity
$67,484
Purchase Details
Closed on
May 25, 2011
Sold by
Grace Terry D
Bought by
Pekins Kristopher M
Home Financials for this Owner
Home Financials are based on the most recent Mortgage that was taken out on this home.
Original Mortgage
$62,176
Interest Rate
4.81%
Mortgage Type
New Conventional
Purchase Details
Closed on
Aug 8, 2002
Sold by
Anna Phillip and Anna Rafferty
Bought by
Kenna Terry and Kenna Grace
Create a Home Valuation Report for This Property
The Home Valuation Report is an in-depth analysis detailing your home's value as well as a comparison with similar homes in the area
Home Values in the Area
Average Home Value in this Area
Purchase History
| Date | Buyer | Sale Price | Title Company |
|---|---|---|---|
| Cook Zachary Wayne | -- | None Available | |
| Cook Zachary Wayne | $89,900 | None Available | |
| Pekins Kristopher M | $58,900 | -- | |
| Kenna Terry | $55,000 | -- |
Source: Public Records
Mortgage History
| Date | Status | Borrower | Loan Amount |
|---|---|---|---|
| Open | Cook Zachary Wayne | $81,921 | |
| Previous Owner | Pekins Kristopher M | $62,176 |
Source: Public Records
Tax History Compared to Growth
Tax History
| Year | Tax Paid | Tax Assessment Tax Assessment Total Assessment is a certain percentage of the fair market value that is determined by local assessors to be the total taxable value of land and additions on the property. | Land | Improvement |
|---|---|---|---|---|
| 2024 | $930 | $10,491 | $1,293 | $9,198 |
| 2023 | $930 | $10,186 | $1,293 | $8,893 |
| 2022 | $860 | $9,889 | $1,293 | $8,596 |
| 2021 | $865 | $9,889 | $1,293 | $8,596 |
| 2020 | $852 | $9,889 | $1,293 | $8,596 |
| 2019 | $591 | $6,447 | $817 | $5,630 |
| 2018 | $582 | $6,447 | $817 | $5,630 |
| 2017 | $623 | $6,578 | $817 | $5,761 |
| 2016 | $616 | $6,709 | $817 | $5,892 |
| 2015 | $618 | $6,744 | $817 | $5,927 |
| 2014 | -- | $6,630 | $817 | $5,813 |
Source: Public Records
Map
Nearby Homes
- 1110 N 6th St
- 1102 N 5th St
- 1005 N 5th St
- 1200 N Main St
- 1110 N Main St
- 1009 N 6th St
- 112 Wheatheart Dr
- 810 N Main St
- 1008 N 10th St
- 302 N Barnes St
- 316 N Jenkins St
- 1004 E North Ave
- 1208 E Allen Ave
- 206 W Grand Ave
- 501 E Grand Ave
- 103 S 4th St
- 1409 E North Ave
- 109 S 10th St
- 207 S Barnes St
- 305 S 4th St