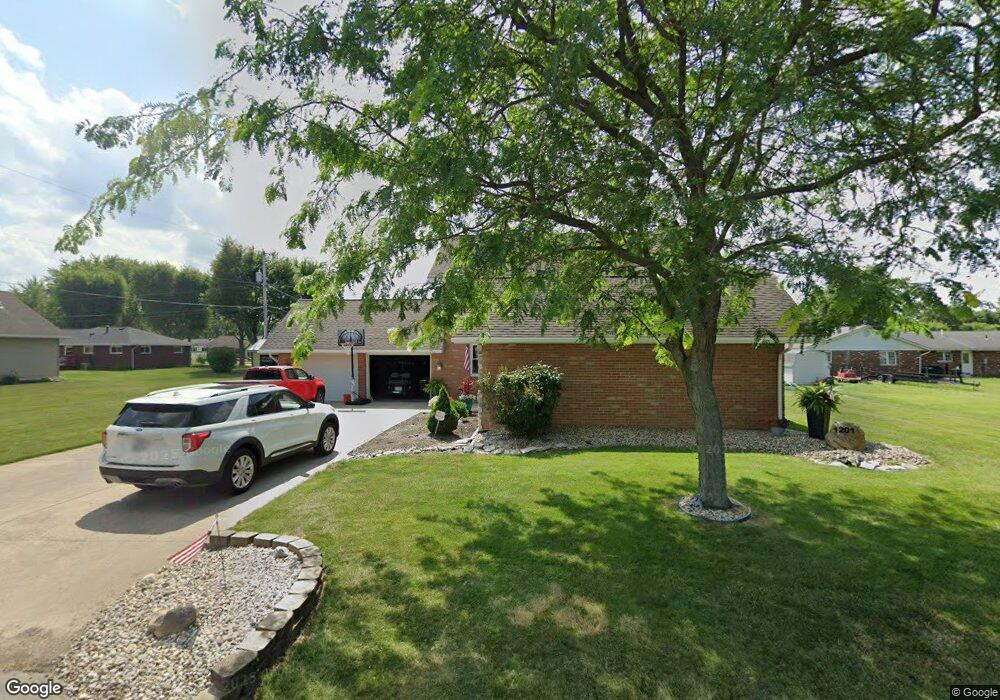
1201 Park Ave Delphos, OH 45833
Estimated Value: $280,000 - $319,806
4
Beds
3
Baths
1,808
Sq Ft
$167/Sq Ft
Est. Value
About This Home
This home is located at 1201 Park Ave, Delphos, OH 45833 and is currently estimated at $302,452, approximately $167 per square foot. 1201 Park Ave is a home located in Van Wert County with nearby schools including Delphos St. John's High School and Delphos St. John's Elementary School.
Ownership History
Date
Name
Owned For
Owner Type
Purchase Details
Closed on
Sep 10, 2015
Sold by
Plokhooy David B
Bought by
Allemeier Shawn and Allemeier Christie E
Current Estimated Value
Home Financials for this Owner
Home Financials are based on the most recent Mortgage that was taken out on this home.
Original Mortgage
$152,000
Outstanding Balance
$118,974
Interest Rate
3.97%
Mortgage Type
New Conventional
Estimated Equity
$183,478
Purchase Details
Closed on
Jul 17, 2011
Sold by
Querry Chad E
Bought by
Plokhooy David B
Home Financials for this Owner
Home Financials are based on the most recent Mortgage that was taken out on this home.
Original Mortgage
$167,346
Interest Rate
4.56%
Mortgage Type
VA
Purchase Details
Closed on
Dec 3, 2008
Sold by
Querry Stacy L
Bought by
Querry Chad E
Purchase Details
Closed on
Feb 24, 1998
Bought by
Odenweller Bradford J and Odenweller Ju
Create a Home Valuation Report for This Property
The Home Valuation Report is an in-depth analysis detailing your home's value as well as a comparison with similar homes in the area
Home Values in the Area
Average Home Value in this Area
Purchase History
| Date | Buyer | Sale Price | Title Company |
|---|---|---|---|
| Allemeier Shawn | $160,000 | Attorney | |
| Plokhooy David B | $162,000 | Attorney | |
| Querry Chad E | -- | Attorney | |
| Odenweller Bradford J | $150,000 | -- | |
| Odenweller Bradford J | $150,000 | -- |
Source: Public Records
Mortgage History
| Date | Status | Borrower | Loan Amount |
|---|---|---|---|
| Open | Allemeier Shawn | $152,000 | |
| Closed | Plokhooy David B | $167,346 |
Source: Public Records
Tax History
| Year | Tax Paid | Tax Assessment Tax Assessment Total Assessment is a certain percentage of the fair market value that is determined by local assessors to be the total taxable value of land and additions on the property. | Land | Improvement |
|---|---|---|---|---|
| 2024 | $2,734 | $97,220 | $8,720 | $88,500 |
| 2023 | $2,726 | $97,220 | $8,720 | $88,500 |
| 2022 | $2,144 | $69,970 | $7,550 | $62,420 |
| 2021 | $2,152 | $69,970 | $7,550 | $62,420 |
| 2020 | $2,174 | $68,890 | $6,470 | $62,420 |
| 2019 | $1,868 | $65,420 | $6,470 | $58,950 |
| 2018 | $1,872 | $65,420 | $6,470 | $58,950 |
| 2017 | $1,838 | $65,420 | $6,470 | $58,950 |
| 2016 | $1,787 | $62,940 | $6,470 | $56,470 |
| 2015 | $1,787 | $62,940 | $6,470 | $56,470 |
| 2014 | $1,876 | $62,940 | $6,470 | $56,470 |
| 2013 | $2,000 | $62,940 | $6,470 | $56,470 |
Source: Public Records
Map
Nearby Homes
- 10429 Ohio 66
- 702 N Main St
- 629 N Main St
- 537 / 539 Toomey
- 610 N Washington St
- 704 N Franklin St
- 409 N Bredeick St
- 201 E 5th St
- 709 W 4th St
- 405 N Franklin St
- 708 W 1st St
- 221 S Main St
- 821 E 3rd St
- 420 S Cass St
- 424 S Canal St
- 483 S Franklin St
- 310 E Suthoff St
- 827 S Washington St
- 1000 Colettas Way
- 241 King St
Your Personal Tour Guide
Ask me questions while you tour the home.