
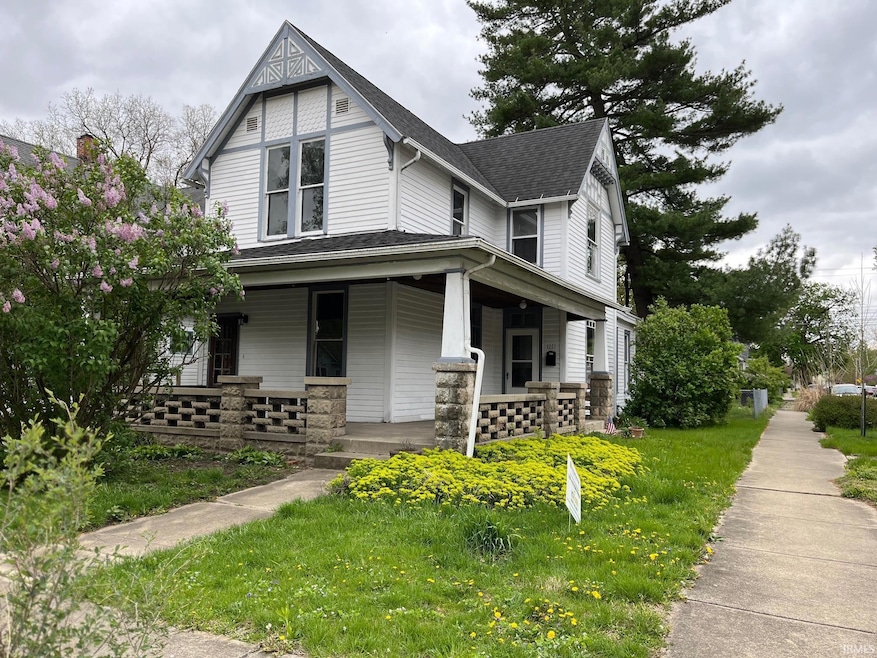
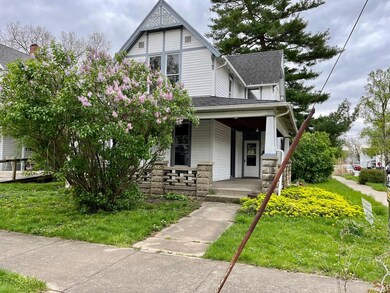

1201 Roberts St Lafayette, IN 47904
Lincoln Neighborhood
4
Beds
2
Baths
1,800
Sq Ft
5,160
Sq Ft Lot
Highlights
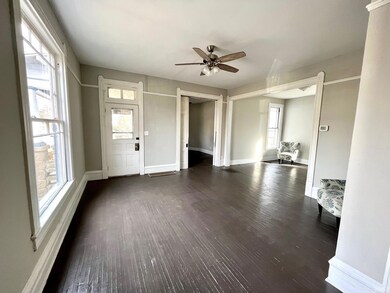
- Traditional Architecture
- Corner Lot
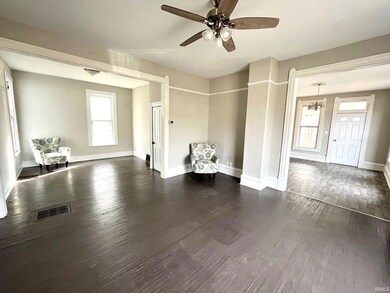
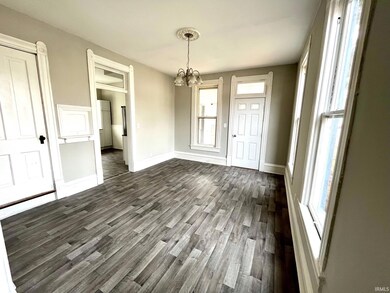
- Formal Dining Room
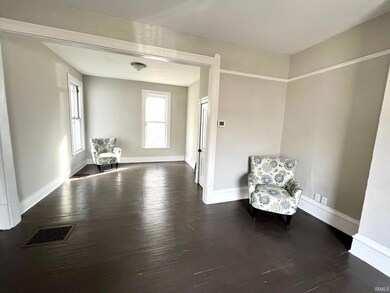
- Wood Flooring
- Covered patio or porch
- Forced Air Heating and Cooling System
About This Home
As of May 2023This turn of the century home, sits on a large corner lot with a central location to shopping, schools, parks and all that the city of Lafayette has to offer! With 4 beds & 2 baths, formal dining room plus an office, toy room or library! This home has kept so much of its original charm but also has many new & modern updates including, SS kitchen appliances, kitchen cabinets & countertops, new lighting throughout, all updated plumbing and electrical, fresh paint inside and out, 2 Hi-Eff furnaces, newer roof & more! The exterior offers a full fenced-in yard & off-street parking. 100% conventional financing with homebuyers grant money is available!!
Home Details
Home Type
- Single Family
Est. Annual Taxes
- $518
Year Built
- Built in 1901
Lot Details
- 5,160 Sq Ft Lot
- Corner Lot
Parking
- Driveway
Home Design
- Traditional Architecture
- Brick Foundation
- Wood Siding
Interior Spaces
- 2-Story Property
- Formal Dining Room
- Laundry on main level
Flooring
- Wood
- Laminate
Bedrooms and Bathrooms
- 4 Bedrooms
Partially Finished Basement
- Block Basement Construction
- Basement Cellar
Outdoor Features
- Covered patio or porch
Schools
- Thomas Miller Elementary School
- Sunnyside/Tecumseh Middle School
- Jefferson High School
Utilities
- Forced Air Heating and Cooling System
- Heating System Uses Gas
Community Details
- Roger Subdivision
Listing and Financial Details
- Assessor Parcel Number 79-07-21-109-006.000-004
Ownership History
Date
Name
Owned For
Owner Type
Purchase Details
Listed on
Feb 12, 2023
Closed on
May 17, 2023
Sold by
Achieve Marketing & Consulting Llc
Bought by
Macias Daniel and Macias Tristan N
Seller's Agent
Katie Viers
F.C. Tucker West Central
Buyer's Agent
Cara McLean-Rolfes
Trueblood Real Estate
List Price
$189,900
Sold Price
$183,000
Premium/Discount to List
-$6,900
-3.63%
Views
735
Current Estimated Value
Home Financials for this Owner
Home Financials are based on the most recent Mortgage that was taken out on this home.
Estimated Appreciation
-$12,367
Avg. Annual Appreciation
-3.63%
Original Mortgage
$179,685
Outstanding Balance
$176,521
Interest Rate
7.7%
Mortgage Type
FHA
Estimated Equity
-$8,019
Purchase Details
Listed on
Apr 6, 2022
Closed on
Apr 15, 2022
Sold by
Jeanne Phillips Sharon
Bought by
Achieve Marketing & Consulting Llc
Seller's Agent
John Townsend
Trueblood Real Estate
Buyer's Agent
John Townsend
Trueblood Real Estate
List Price
$69,900
Sold Price
$86,700
Premium/Discount to List
$16,800
24.03%
Home Financials for this Owner
Home Financials are based on the most recent Mortgage that was taken out on this home.
Avg. Annual Appreciation
98.45%
Similar Homes in Lafayette, IN
Create a Home Valuation Report for This Property
The Home Valuation Report is an in-depth analysis detailing your home's value as well as a comparison with similar homes in the area
Home Values in the Area
Average Home Value in this Area
Purchase History
| Date | Type | Sale Price | Title Company |
|---|---|---|---|
| Warranty Deed | $183,000 | None Listed On Document | |
| Warranty Deed | $86,700 | None Listed On Document |
Source: Public Records
Mortgage History
| Date | Status | Loan Amount | Loan Type |
|---|---|---|---|
| Open | $179,685 | FHA |
Source: Public Records
Property History
| Date | Event | Price | Change | Sq Ft Price |
|---|---|---|---|---|
| 05/17/2023 05/17/23 | Sold | $183,000 | 0.0% | $102 / Sq Ft |
| 05/17/2023 05/17/23 | Sold | $183,000 | +0.6% | $102 / Sq Ft |
| 05/17/2023 05/17/23 | Pending | -- | -- | -- |
| 05/17/2023 05/17/23 | Price Changed | $181,900 | 0.0% | $101 / Sq Ft |
| 04/29/2023 04/29/23 | Pending | -- | -- | -- |
| 04/28/2023 04/28/23 | Price Changed | $181,900 | -4.2% | $101 / Sq Ft |
| 04/23/2023 04/23/23 | For Sale | $189,900 | 0.0% | $106 / Sq Ft |
| 04/07/2023 04/07/23 | Pending | -- | -- | -- |
| 03/20/2023 03/20/23 | Price Changed | $189,900 | -1.1% | $106 / Sq Ft |
| 03/16/2023 03/16/23 | Price Changed | $192,000 | -1.5% | $107 / Sq Ft |
| 03/04/2023 03/04/23 | Price Changed | $194,900 | -2.5% | $108 / Sq Ft |
| 02/20/2023 02/20/23 | Price Changed | $199,900 | -2.5% | $111 / Sq Ft |
| 02/12/2023 02/12/23 | For Sale | $205,000 | +12.0% | $114 / Sq Ft |
| 01/12/2023 01/12/23 | Off Market | $183,000 | -- | -- |
| 12/29/2022 12/29/22 | Price Changed | $205,000 | -4.7% | $114 / Sq Ft |
| 11/17/2022 11/17/22 | For Sale | $215,000 | +148.0% | $119 / Sq Ft |
| 04/15/2022 04/15/22 | Sold | $86,700 | +24.0% | $48 / Sq Ft |
| 04/07/2022 04/07/22 | Pending | -- | -- | -- |
| 04/06/2022 04/06/22 | For Sale | $69,900 | -- | $39 / Sq Ft |
Source: Indiana Regional MLS
Tax History Compared to Growth
Tax History
| Year | Tax Paid | Tax Assessment Tax Assessment Total Assessment is a certain percentage of the fair market value that is determined by local assessors to be the total taxable value of land and additions on the property. | Land | Improvement |
|---|---|---|---|---|
| 2024 | $1,176 | $139,300 | $13,000 | $126,300 |
| 2023 | $969 | $123,500 | $13,000 | $110,500 |
| 2022 | $127 | $103,300 | $13,000 | $90,300 |
| 2021 | $125 | $82,800 | $13,000 | $69,800 |
| 2020 | $122 | $78,700 | $13,000 | $65,700 |
| 2019 | $120 | $73,300 | $11,000 | $62,300 |
| 2018 | $118 | $73,300 | $11,000 | $62,300 |
| 2017 | $115 | $71,300 | $11,000 | $60,300 |
| 2016 | $113 | $68,600 | $11,000 | $57,600 |
| 2014 | $123 | $69,600 | $11,000 | $58,600 |
| 2013 | $372 | $66,300 | $11,000 | $55,300 |
Source: Public Records
Agents Affiliated with this Home
-
Seller's Agent in 2023
Katie Viers
F.C. Tucker West Central
(219) 776-5120
2 in this area
111 Total Sales
-
Buyer's Agent in 2023
Cara McLean-Rolfes
Trueblood Real Estate
(765) 714-3569
2 in this area
119 Total Sales
-
N
Buyer's Agent in 2023
Non-BLC Member
MIBOR REALTOR® Association
-
I
Buyer's Agent in 2023
IUO Non-BLC Member
Non-BLC Office
-
Seller's Agent in 2022
John Townsend
Trueblood Real Estate
(765) 250-0050
3 in this area
155 Total Sales
Map
Source: Indiana Regional MLS
MLS Number: 202304006
APN: 79-07-21-109-006.000-004
Disclaimer: Certain information contained herein is derived from information provided by parties other than Homes.com. All information provided is deemed reliable, but is not guaranteed to be accurate and should be independently verified.
![]() IDX information is provided exclusively for personal, non-commercial use, and may not be used for any purpose other than to identify prospective properties consumers may be interested in purchasing. Information is deemed reliable but not guaranteed.
IDX information is provided exclusively for personal, non-commercial use, and may not be used for any purpose other than to identify prospective properties consumers may be interested in purchasing. Information is deemed reliable but not guaranteed.
Nearby Homes
- 1213 Morton St
- 1000 Hartford St
- 827 N 13th St
- 1706 Pierce St
- 1800 Greenbush St
- 620 N 11th St Unit 22
- 1804 Maple St
- 1201 Cincinnati St
- 1906 N 15th St
- 1931 Morton St
- 1608 Hart St
- 1834 Union St
- 907 N 20th St Unit 2
- 902 N St Unit 2
- 108 Barbee St
- 629 North St
- 2131 Union St
- E 725 North St
- 1440 South St
- 2022 Elk St