1201 S 7th St Lincoln, NE 68502
South Salt Creek NeighborhoodEstimated Value: $211,000 - $281,000
4
Beds
4
Baths
1,560
Sq Ft
$152/Sq Ft
Est. Value
About This Home
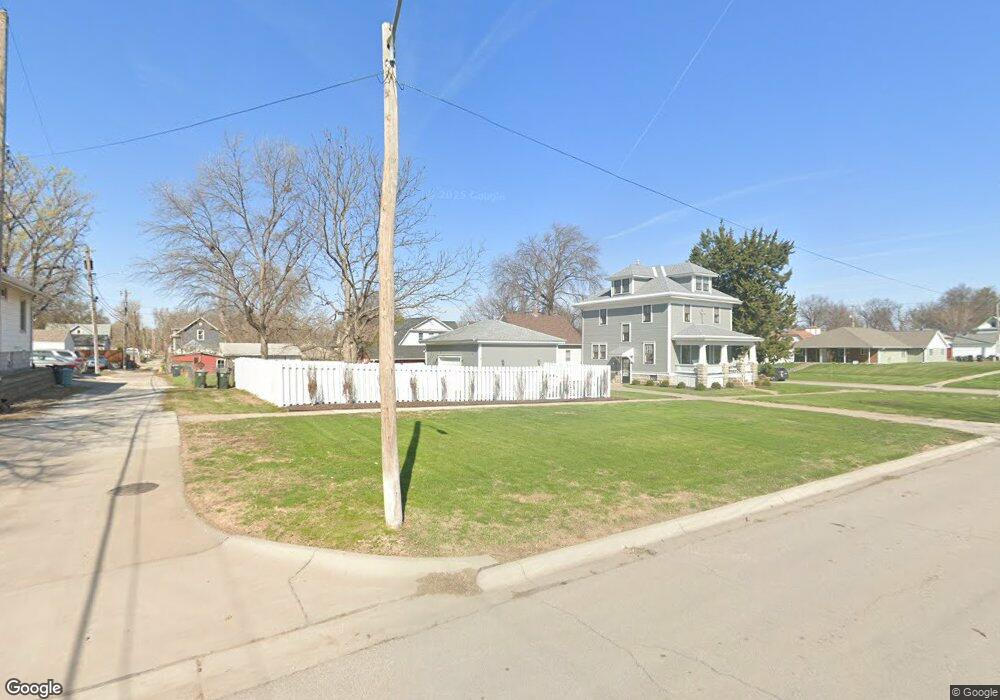
This home is located at 1201 S 7th St, Lincoln, NE 68502 and is currently estimated at $237,753, approximately $152 per square foot. 1201 S 7th St is a home located in Lancaster County with nearby schools including Everett Elementary School, Park Middle School, and Lincoln High School.
Ownership History
Date
Name
Owned For
Owner Type
Purchase Details
Closed on
Jul 1, 2004
Sold by
Beckman Brent Dale and Beckman Lori L
Bought by
Debowey Damon Jack
Current Estimated Value
Home Financials for this Owner
Home Financials are based on the most recent Mortgage that was taken out on this home.
Original Mortgage
$106,400
Outstanding Balance
$48,318
Interest Rate
4.95%
Mortgage Type
Unknown
Estimated Equity
$189,435
Create a Home Valuation Report for This Property
The Home Valuation Report is an in-depth analysis detailing your home's value as well as a comparison with similar homes in the area
Home Values in the Area
Average Home Value in this Area
Purchase History
| Date | Buyer | Sale Price | Title Company |
|---|---|---|---|
| Debowey Damon Jack | $133,000 | -- |
Source: Public Records
Mortgage History
| Date | Status | Borrower | Loan Amount |
|---|---|---|---|
| Open | Debowey Damon Jack | $106,400 |
Source: Public Records
Tax History Compared to Growth
Tax History
| Year | Tax Paid | Tax Assessment Tax Assessment Total Assessment is a certain percentage of the fair market value that is determined by local assessors to be the total taxable value of land and additions on the property. | Land | Improvement |
|---|---|---|---|---|
| 2025 | $2,696 | $215,700 | $36,000 | $179,700 |
| 2024 | $2,696 | $195,100 | $33,000 | $162,100 |
| 2023 | $3,270 | $195,100 | $33,000 | $162,100 |
| 2022 | $3,404 | $170,800 | $30,000 | $140,800 |
| 2021 | $2,988 | $158,500 | $30,000 | $128,500 |
| 2020 | $2,438 | $127,600 | $25,000 | $102,600 |
| 2019 | $2,438 | $127,600 | $25,000 | $102,600 |
| 2018 | $2,321 | $120,900 | $25,000 | $95,900 |
| 2017 | $2,342 | $120,900 | $25,000 | $95,900 |
| 2016 | $2,450 | $125,800 | $25,000 | $100,800 |
| 2015 | $2,433 | $125,800 | $25,000 | $100,800 |
| 2014 | $2,095 | $107,700 | $25,000 | $82,700 |
| 2013 | -- | $107,700 | $25,000 | $82,700 |
Source: Public Records
Map
Nearby Homes