Estimated Value: $755,000 - $796,000
5
Beds
3
Baths
3,244
Sq Ft
$239/Sq Ft
Est. Value
About This Home
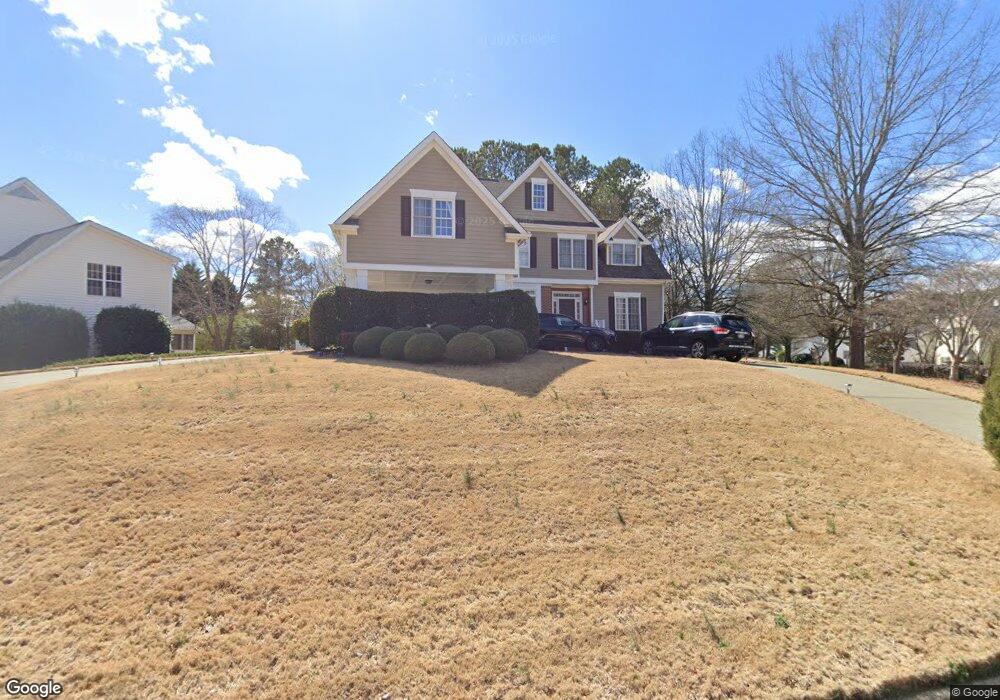
This home is located at 1201 Tartarian Trail, Apex, NC 27502 and is currently estimated at $775,284, approximately $238 per square foot. 1201 Tartarian Trail is a home located in Wake County with nearby schools including Scotts Ridge Elementary School, Apex Middle, and Apex High School.
Ownership History
Date
Name
Owned For
Owner Type
Purchase Details
Closed on
Sep 25, 2003
Sold by
Li Feng and Li Yong
Bought by
Zhou Josephine
Current Estimated Value
Home Financials for this Owner
Home Financials are based on the most recent Mortgage that was taken out on this home.
Original Mortgage
$296,000
Interest Rate
5.75%
Mortgage Type
Purchase Money Mortgage
Purchase Details
Closed on
Feb 5, 2001
Sold by
Li Feng
Bought by
Li Feng and Li Yong
Home Financials for this Owner
Home Financials are based on the most recent Mortgage that was taken out on this home.
Original Mortgage
$247,500
Interest Rate
7.18%
Purchase Details
Closed on
Feb 2, 2001
Sold by
Heritage Custom Homes Inc
Bought by
Li Feng
Home Financials for this Owner
Home Financials are based on the most recent Mortgage that was taken out on this home.
Original Mortgage
$247,500
Interest Rate
7.18%
Create a Home Valuation Report for This Property
The Home Valuation Report is an in-depth analysis detailing your home's value as well as a comparison with similar homes in the area
Home Values in the Area
Average Home Value in this Area
Purchase History
| Date | Buyer | Sale Price | Title Company |
|---|---|---|---|
| Zhou Josephine | -- | Title Insurance Co | |
| Li Feng | -- | -- | |
| Li Feng | $330,000 | -- |
Source: Public Records
Mortgage History
| Date | Status | Borrower | Loan Amount |
|---|---|---|---|
| Open | Zhou Josephine | $281,600 | |
| Closed | Zhou Josephine | $22,000 | |
| Closed | Zhou Josephine | $296,000 | |
| Previous Owner | Li Feng | $247,500 |
Source: Public Records
Tax History Compared to Growth
Tax History
| Year | Tax Paid | Tax Assessment Tax Assessment Total Assessment is a certain percentage of the fair market value that is determined by local assessors to be the total taxable value of land and additions on the property. | Land | Improvement |
|---|---|---|---|---|
| 2025 | $6,076 | $693,668 | $190,000 | $503,668 |
| 2024 | $5,775 | $674,262 | $190,000 | $484,262 |
| 2023 | $5,045 | $458,023 | $68,000 | $390,023 |
| 2022 | $4,735 | $458,023 | $68,000 | $390,023 |
| 2021 | $4,554 | $458,023 | $68,000 | $390,023 |
| 2020 | $4,509 | $458,023 | $68,000 | $390,023 |
| 2019 | $4,430 | $388,268 | $68,000 | $320,268 |
| 2018 | $4,172 | $388,268 | $68,000 | $320,268 |
| 2017 | $3,883 | $388,268 | $68,000 | $320,268 |
| 2016 | $3,827 | $388,268 | $68,000 | $320,268 |
| 2015 | $3,636 | $359,990 | $68,000 | $291,990 |
| 2014 | -- | $359,990 | $68,000 | $291,990 |
Source: Public Records
Map
Nearby Homes
- 1116 Silky Dogwood Trail
- 1105 Capitata Crossing
- 2000 Silky Dogwood Trail
- 1106 Purple Glory Dr
- 3021 White Cloud Cir
- 2010 Silky Dogwood Trail
- 1003 Red Sunset Dr
- 1800 Pierre Place
- 1005 Fairfax Woods Dr
- 149 Sharp Top Trail
- 1410 Big Leaf Loop
- 1307 Chenworth Dr
- 1421 Big Leaf Loop
- 1206 Fairfax Woods Dr
- 1302 Brycker Ct
- 901 Town Side Dr
- 1099 Vauxhall Dr
- 213 Pikeview Ln
- 1059 Torrence Dr
- 507 Village Loop Dr
- 1205 Tartarian Trail
- 1202 Summer Stars Ct
- 1202 Summer Stars St
- 1209 Tartarian Trail
- 1120 Silky Dogwood Trail
- 1118 Silky Dogwood Trail
- 1200 Tartarian Trail
- 1122 Silky Dogwood Trail
- 1202 Tartarian Trail
- 1114 Silky Dogwood Trail
- 1200 Summer Stars Ct
- 1124 Silky Dogwood Trail
- 1200 Summer Stars St
- 1213 Tartarian Trail
- 1206 Tartarian Trail
- 1126 Silky Dogwood Trail
- 1102 Capitata Crossing
- 1208 Tartarian Trail
- 1110 Silky Dogwood Trail
- 1117 Silky Dogwood Trail