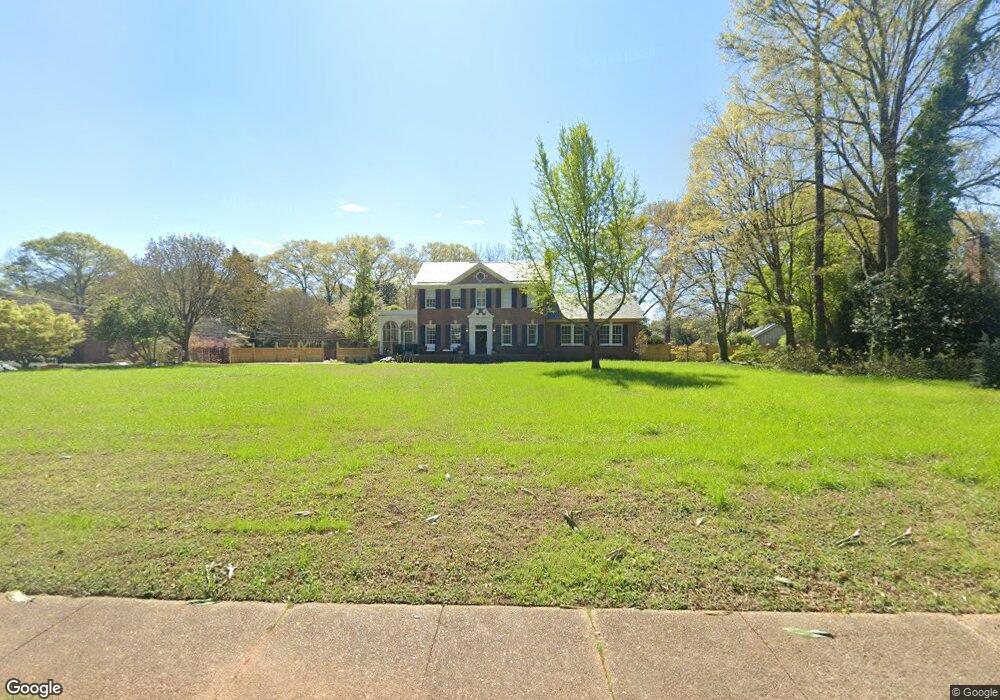
1201 Vernon St Unit 1 & 2 Lagrange, GA 30240
Estimated Value: $538,000 - $692,000
5
Beds
4
Baths
3,770
Sq Ft
$165/Sq Ft
Est. Value
About This Home
This home is located at 1201 Vernon St Unit 1 & 2, Lagrange, GA 30240 and is currently estimated at $620,323, approximately $164 per square foot. 1201 Vernon St Unit 1 & 2 is a home located in Troup County with nearby schools including Ethel W. Kight Elementary School, Hollis Hand Elementary School, and Franklin Forest Elementary School.
Ownership History
Date
Name
Owned For
Owner Type
Purchase Details
Closed on
Aug 26, 2020
Sold by
Traylor Properties Of Lagrange Llc
Bought by
Sample David and Hawkins Craig Matthew
Current Estimated Value
Home Financials for this Owner
Home Financials are based on the most recent Mortgage that was taken out on this home.
Original Mortgage
$440,000
Outstanding Balance
$390,471
Interest Rate
2.9%
Mortgage Type
New Conventional
Estimated Equity
$229,852
Purchase Details
Closed on
Feb 28, 2019
Sold by
Williams Mary Ann
Bought by
Mary Ann T Williams Living Trust
Purchase Details
Closed on
May 25, 2006
Sold by
Hudson William B
Bought by
Hudson Mary Ann T
Purchase Details
Closed on
Aug 12, 1971
Sold by
Helwn Hearn Daniel
Bought by
William B Hudson
Purchase Details
Closed on
Jan 1, 1957
Sold by
Ely R Callaway
Bought by
Helwn Hearn Daniel
Create a Home Valuation Report for This Property
The Home Valuation Report is an in-depth analysis detailing your home's value as well as a comparison with similar homes in the area
Home Values in the Area
Average Home Value in this Area
Purchase History
| Date | Buyer | Sale Price | Title Company |
|---|---|---|---|
| Sample David | $490,000 | -- | |
| Mary Ann T Williams Living Trust | -- | -- | |
| Hudson Mary Ann T | -- | -- | |
| William B Hudson | $53,500 | -- | |
| Helwn Hearn Daniel | -- | -- |
Source: Public Records
Mortgage History
| Date | Status | Borrower | Loan Amount |
|---|---|---|---|
| Open | Sample David | $440,000 |
Source: Public Records
Tax History Compared to Growth
Tax History
| Year | Tax Paid | Tax Assessment Tax Assessment Total Assessment is a certain percentage of the fair market value that is determined by local assessors to be the total taxable value of land and additions on the property. | Land | Improvement |
|---|---|---|---|---|
| 2024 | $6,654 | $243,968 | $27,680 | $216,288 |
| 2023 | $6,225 | $228,256 | $27,680 | $200,576 |
| 2022 | $5,443 | $195,016 | $27,680 | $167,336 |
| 2021 | $5,838 | $193,560 | $27,680 | $165,880 |
| 2020 | $5,571 | $186,720 | $22,280 | $164,440 |
| 2019 | $5,370 | $180,040 | $22,280 | $157,760 |
| 2018 | $5,225 | $175,240 | $17,480 | $157,760 |
| 2017 | $5,225 | $175,240 | $17,480 | $157,760 |
| 2016 | $5,219 | $175,040 | $17,480 | $157,560 |
| 2015 | $5,374 | $179,865 | $22,304 | $157,560 |
| 2014 | $5,132 | $171,572 | $22,304 | $149,268 |
| 2013 | -- | $156,860 | $21,152 | $135,708 |
Source: Public Records
Map
Nearby Homes
- 209 N Lee St
- 217 Jefferson St
- 0 N Lee St Unit 10550825
- 211 Moores Hill
- 0 Moores Hill
- 507 S Lee St
- 109 Waverly Way
- 110 Waverly Way
- 107 Clark St
- 203 Waverly Way
- 208 Boulevard
- 513 Park Ave
- 209 Boulevard
- 500 Boulevard
- 102 Parker St
- 202 Parker Ln
- 610 Wilburn Ave
- 608 Wilburn Ave
- 612 S Lee St
- 109 Garfield St
- 1201 Vernon St
- 0 Vernon St Unit 7300120
- 0 Vernon St Unit 3272720
- 0 Vernon St Unit 7125555
- 0 Vernon St Unit 8325972
- 0 Vernon St Unit 8007872
- 0 Vernon St Unit 7600674
- 0 Vernon St Unit 8215619
- 0 Vernon St Unit 8321436
- 0 Vernon St Unit 7424385
- 0 Vernon St Unit 7347118
- 0 Vernon St Unit 7286982
- 0 Vernon St Unit 3143686
- 0 Vernon St Unit 2975284
- 0 Vernon St Unit 7456806
- 0 Vernon St Unit 7050674
- 0 Vernon St Unit 7124290
- 0 Vernon St Unit 8503239
- 0 Vernon St Unit 3127385
- 0 Vernon St Unit 8885571