Estimated Value: $685,768 - $812,000
--
Bed
--
Bath
3,742
Sq Ft
$203/Sq Ft
Est. Value
About This Home
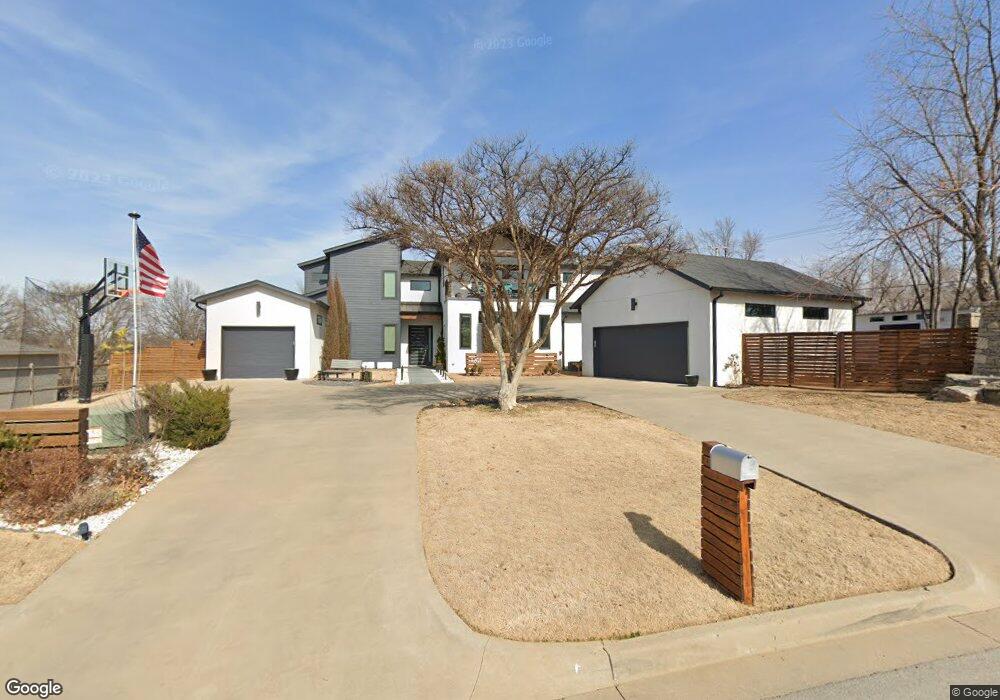
This home is located at 1201 W 108th St S, Jenks, OK 74037 and is currently estimated at $760,442, approximately $203 per square foot. 1201 W 108th St S is a home located in Tulsa County with nearby schools including Jenks West Elementary School, Jenks West Intermediate Elementary School, and Jenks Middle School.
Ownership History
Date
Name
Owned For
Owner Type
Purchase Details
Closed on
Nov 1, 2021
Sold by
Box Cory S and Box Samantha D
Bought by
Cory S Box And Samantha D Box Revocable Livin and Box
Current Estimated Value
Purchase Details
Closed on
Jan 17, 2014
Sold by
Restore And More Inc
Bought by
Box Cory S and Box Samantha D
Home Financials for this Owner
Home Financials are based on the most recent Mortgage that was taken out on this home.
Original Mortgage
$95,000
Interest Rate
4.47%
Mortgage Type
Future Advance Clause Open End Mortgage
Create a Home Valuation Report for This Property
The Home Valuation Report is an in-depth analysis detailing your home's value as well as a comparison with similar homes in the area
Home Values in the Area
Average Home Value in this Area
Purchase History
| Date | Buyer | Sale Price | Title Company |
|---|---|---|---|
| Cory S Box And Samantha D Box Revocable Livin | -- | None Listed On Document | |
| Box Cory S | $95,000 | Executives Title & Escrow C |
Source: Public Records
Mortgage History
| Date | Status | Borrower | Loan Amount |
|---|---|---|---|
| Previous Owner | Box Cory S | $95,000 |
Source: Public Records
Tax History Compared to Growth
Tax History
| Year | Tax Paid | Tax Assessment Tax Assessment Total Assessment is a certain percentage of the fair market value that is determined by local assessors to be the total taxable value of land and additions on the property. | Land | Improvement |
|---|---|---|---|---|
| 2024 | $6,616 | $53,553 | $6,717 | $46,836 |
| 2023 | $6,616 | $52,964 | $6,155 | $46,809 |
| 2022 | $6,482 | $50,421 | $10,247 | $40,174 |
| 2021 | $6,566 | $50,421 | $10,247 | $40,174 |
| 2020 | $6,421 | $50,421 | $10,247 | $40,174 |
| 2019 | $6,465 | $50,421 | $10,247 | $40,174 |
| 2018 | $6,509 | $50,421 | $10,247 | $40,174 |
| 2017 | $6,402 | $51,421 | $10,450 | $40,971 |
| 2016 | $6,310 | $49,500 | $10,450 | $0 |
| 2015 | $1,385 | $10,450 | $10,450 | $0 |
| 2014 | $1,127 | $8,311 | $8,311 | $0 |
Source: Public Records
Map
Nearby Homes
- 10715 S Elgin
- 1113 W 108th Place S
- 1116 W 108th Place S
- 10604 S Holley St
- 1226 W 109th Place S
- 10906 S Mulberry Ave
- 13099 S Harvard
- 10821 S Fir St
- 10625 S Forest Ave
- 11224 S Fir Ave
- 11264 S Fir Ave
- 11312 S Fir Ave
- 11308 S Fir Ave
- 11265 S Fir Ave
- 11261 S Fir Ave
- 11260 S Fir Ave
- 691 W 113th Ct S
- 110 W 113th St S
- 2012 W 109th St S
- 682 W 113th Ct S
- 10712 S Elgin Ave
- 1207 W 108th St S
- 10709 S Elgin Ave
- 10709 S Elgin Ave Unit 2610
- 10724 S Elgin Ave
- 1121 W 108th Place S
- 1121 W 108th Place S
- 10636 S Elgin Ave
- 1213 W 108th St S
- 1210 W 108th St S
- 10723 S Elgin Ave
- 7203 S Brookwater Way
- 1123 W 108th Place S
- 10707 S Elgin Ave
- 10818 S Elgin Ave
- 0 W 108th Place S
- 0 W 108th Place S
- 1217 W 108th St S
- 1218 W 108th St S
- 1117 W 108th Place S