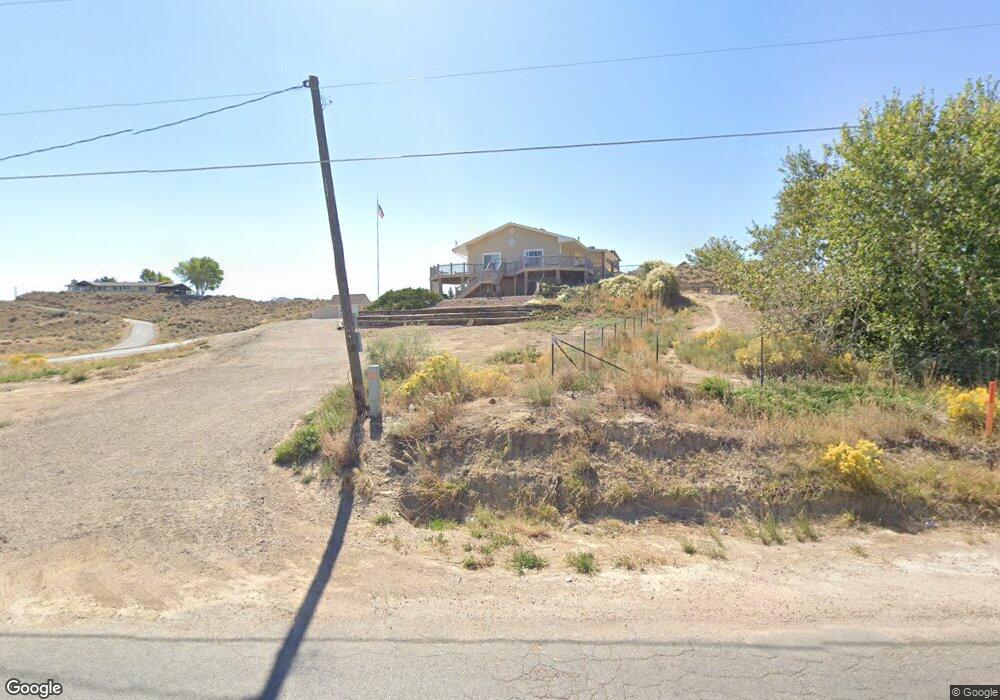
1201 W 2500 S Vernal, UT 84078
Estimated Value: $485,070 - $615,000
3
Beds
2
Baths
2,760
Sq Ft
$194/Sq Ft
Est. Value
About This Home
This home is located at 1201 W 2500 S, Vernal, UT 84078 and is currently estimated at $536,018, approximately $194 per square foot. 1201 W 2500 S is a home located in Uintah County with nearby schools including Discovery School, Vernal Middle School, and Uintah Middle School.
Ownership History
Date
Name
Owned For
Owner Type
Purchase Details
Closed on
Feb 21, 2017
Sold by
Gudac Ed
Bought by
Gudac George Edward and Gudac Jenifer Dudley
Current Estimated Value
Home Financials for this Owner
Home Financials are based on the most recent Mortgage that was taken out on this home.
Original Mortgage
$232,000
Outstanding Balance
$191,925
Interest Rate
4.17%
Mortgage Type
Credit Line Revolving
Estimated Equity
$344,093
Purchase Details
Closed on
Apr 14, 2011
Sold by
Gudac Ed and Gudac Jenifer
Bought by
Gudac Ed and Gudac Jenifer
Purchase Details
Closed on
Jun 30, 2006
Sold by
Schoenrock Paul R
Bought by
Gudac Ed and Gudac Jenifer
Purchase Details
Closed on
Aug 31, 2005
Sold by
Kruzie Ron and Kruzie Sherry A
Bought by
Hickory Homes Llc
Purchase Details
Closed on
Jun 23, 2005
Sold by
Martinsen Wayne D and Martinsen Henrietta
Bought by
Kruzie Ron
Purchase Details
Closed on
Jun 21, 2005
Sold by
Kruzie Ron
Bought by
Kruzie Ron and Kruzie Sherry A
Create a Home Valuation Report for This Property
The Home Valuation Report is an in-depth analysis detailing your home's value as well as a comparison with similar homes in the area
Home Values in the Area
Average Home Value in this Area
Purchase History
| Date | Buyer | Sale Price | Title Company |
|---|---|---|---|
| Gudac George Edward | -- | None Available | |
| Gudac Ed | -- | -- | |
| Gudac Ed | -- | -- | |
| Hickory Homes Llc | -- | -- | |
| Kruzie Ron | -- | -- | |
| Kruzie Ron | -- | -- |
Source: Public Records
Mortgage History
| Date | Status | Borrower | Loan Amount |
|---|---|---|---|
| Open | Gudac George Edward | $232,000 |
Source: Public Records
Tax History Compared to Growth
Tax History
| Year | Tax Paid | Tax Assessment Tax Assessment Total Assessment is a certain percentage of the fair market value that is determined by local assessors to be the total taxable value of land and additions on the property. | Land | Improvement |
|---|---|---|---|---|
| 2024 | $2,697 | $320,927 | $25,188 | $295,739 |
| 2023 | $2,697 | $284,608 | $25,188 | $259,420 |
| 2022 | $2,401 | $232,724 | $25,188 | $207,536 |
| 2021 | $2,490 | $198,134 | $25,188 | $172,946 |
| 2020 | $2,370 | $193,586 | $22,000 | $171,586 |
| 2019 | $2,399 | $193,586 | $22,000 | $171,586 |
| 2018 | $2,294 | $185,415 | $22,000 | $163,415 |
| 2017 | $23 | $185,415 | $22,000 | $163,415 |
| 2016 | $2,089 | $185,415 | $22,000 | $163,415 |
| 2015 | $2,002 | $192,861 | $22,000 | $170,861 |
| 2014 | $1,879 | $183,190 | $22,000 | $161,190 |
| 2013 | $1,920 | $183,190 | $22,000 | $161,190 |
Source: Public Records
Map
Nearby Homes
- 873 W 2500 S
- 2807 S 400 W
- 2822 S 350 W
- 2838 S 350 W
- 349 W 2900 S
- 374 W 2050 S
- 567 W 1550 S Unit 12
- 538 W 1550 S Unit 9
- 346 W 2050 S
- 541 W 1500 S Unit 3
- 553 W 1500 S Unit 4
- 565 W 1500 S Unit 5
- 303 W 2000 S
- 1604 W Partridge Dr S
- 3297 S Vernal Ave
- 2245 S Vernal Ave
- 1209 S 1500 W
- 331 W 1500 S
- 876 W 1200 S
- 990 W 1100 S