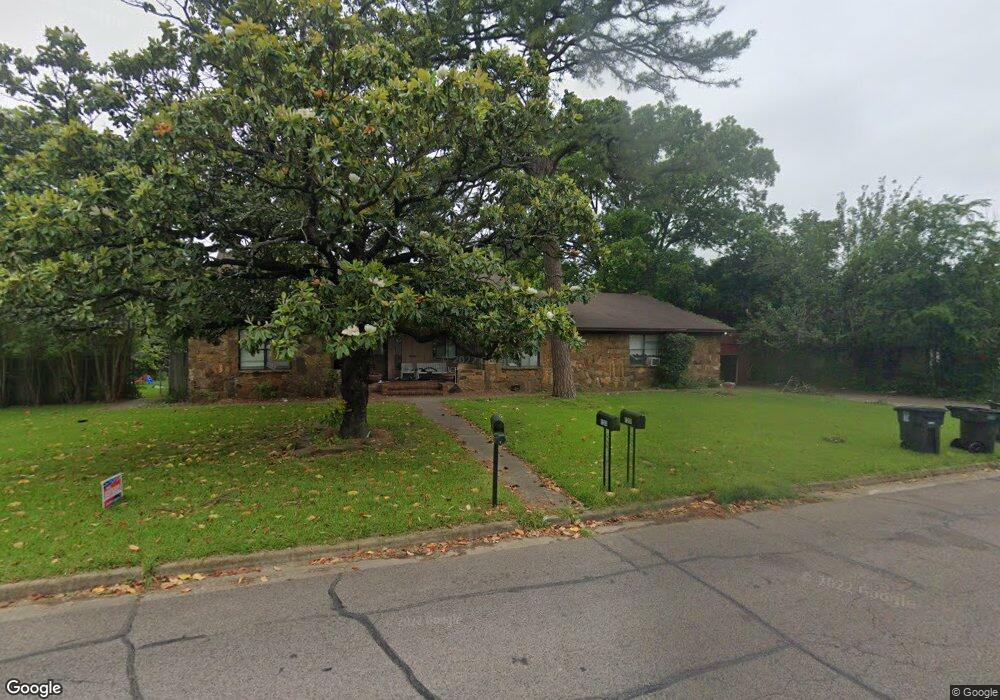
1201 W Elm St Durant, OK 74701
Estimated Value: $259,390 - $419,000
5
Beds
3
Baths
4,816
Sq Ft
$74/Sq Ft
Est. Value
About This Home
This home is located at 1201 W Elm St, Durant, OK 74701 and is currently estimated at $355,848, approximately $73 per square foot. 1201 W Elm St is a home located in Bryan County with nearby schools including Washington Irving Elementary School, Durant Middle School, and Durant Intermediate Elementary School.
Ownership History
Date
Name
Owned For
Owner Type
Purchase Details
Closed on
Jul 31, 2017
Sold by
Minks Lawrence
Bought by
Smith Ammon and Smith Christala
Current Estimated Value
Home Financials for this Owner
Home Financials are based on the most recent Mortgage that was taken out on this home.
Original Mortgage
$229,800
Outstanding Balance
$190,977
Interest Rate
3.9%
Mortgage Type
New Conventional
Estimated Equity
$164,871
Purchase Details
Closed on
Jan 24, 2008
Sold by
Wiley Joe A and Wiley Glenda G
Bought by
Minks Lawrence and Minks Joan
Home Financials for this Owner
Home Financials are based on the most recent Mortgage that was taken out on this home.
Original Mortgage
$211,250
Interest Rate
6.11%
Mortgage Type
New Conventional
Purchase Details
Closed on
Mar 24, 2003
Sold by
Bradford Trust Dr R Et
Bought by
Wiley Joe A and Wiley Glenda G
Purchase Details
Closed on
Mar 11, 1996
Sold by
Bradford Bradford W and Bradford Ferne B
Bought by
Bradford Trust Dr W R Et
Create a Home Valuation Report for This Property
The Home Valuation Report is an in-depth analysis detailing your home's value as well as a comparison with similar homes in the area
Home Values in the Area
Average Home Value in this Area
Purchase History
| Date | Buyer | Sale Price | Title Company |
|---|---|---|---|
| Smith Ammon | $242,000 | None Available | |
| Minks Lawrence | $222,500 | None Available | |
| Wiley Joe A | $155,000 | -- | |
| Bradford Trust Dr W R Et | -- | -- |
Source: Public Records
Mortgage History
| Date | Status | Borrower | Loan Amount |
|---|---|---|---|
| Open | Smith Ammon | $229,800 | |
| Previous Owner | Minks Lawrence | $211,250 |
Source: Public Records
Tax History Compared to Growth
Tax History
| Year | Tax Paid | Tax Assessment Tax Assessment Total Assessment is a certain percentage of the fair market value that is determined by local assessors to be the total taxable value of land and additions on the property. | Land | Improvement |
|---|---|---|---|---|
| 2025 | $1,533 | $16,235 | $2,970 | $13,265 |
| 2024 | $1,947 | $19,994 | $2,970 | $17,024 |
| 2023 | $1,947 | $35,553 | $2,788 | $32,765 |
| 2022 | $3,179 | $33,860 | $2,615 | $31,245 |
| 2021 | $3,102 | $32,248 | $2,451 | $29,797 |
| 2020 | $2,950 | $30,712 | $2,294 | $28,418 |
| 2019 | $2,652 | $29,250 | $2,145 | $27,105 |
| 2018 | $2,503 | $27,857 | $2,145 | $25,712 |
| 2017 | $2,369 | $26,530 | $2,145 | $24,385 |
| 2016 | $2,386 | $26,496 | $2,228 | $24,268 |
| 2015 | $2,196 | $24,475 | $4,125 | $20,350 |
| 2014 | $2,193 | $24,475 | $4,125 | $20,350 |
Source: Public Records
Map
Nearby Homes
- 1124 W Elm St
- 1105 W Elm St
- 1320 W Liveoak St
- 223 N 10th Ave
- 1010 W Evergreen St
- 1501 W Beech St
- 905 W Beech St
- 923 N 12th Ave
- 002 Folsom
- 3800 W Main
- 307 N 8th Ave
- 723 W Locust St
- 701 W Locust St
- 624 W Cedar St
- 1524 Maple St
- 1412 Houston St
- 724 N 7th Ave
- 920 N 7th Ave
- 524 N 6th Ave
- 1418 Baltimore St