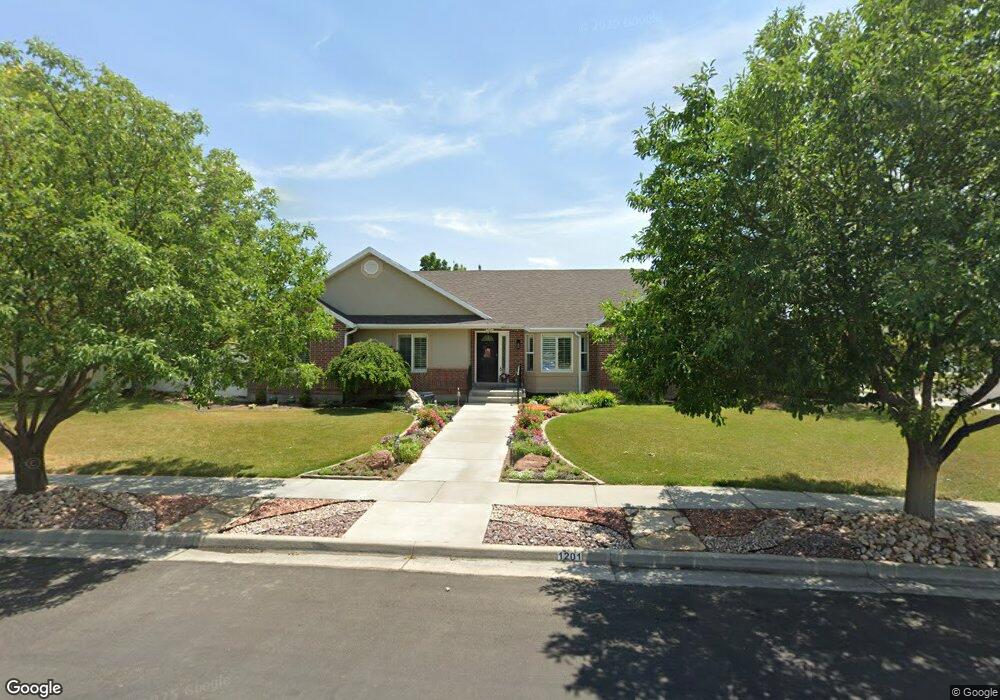
1201 W Sirmingo Way Riverton, UT 84065
Estimated Value: $761,000 - $851,000
5
Beds
3
Baths
3,528
Sq Ft
$230/Sq Ft
Est. Value
About This Home
This home is located at 1201 W Sirmingo Way, Riverton, UT 84065 and is currently estimated at $811,206, approximately $229 per square foot. 1201 W Sirmingo Way is a home located in Salt Lake County with nearby schools including Rosamond Elementary School, Oquirrh Hills Middle School, and Riverton High School.
Ownership History
Date
Name
Owned For
Owner Type
Purchase Details
Closed on
Oct 16, 2020
Sold by
Giles Joseph F and Giles Sue Ellen
Bought by
Giles Joseph and Giles Sue
Current Estimated Value
Home Financials for this Owner
Home Financials are based on the most recent Mortgage that was taken out on this home.
Original Mortgage
$174,950
Outstanding Balance
$155,325
Interest Rate
2.8%
Mortgage Type
New Conventional
Estimated Equity
$655,881
Purchase Details
Closed on
Aug 17, 2016
Sold by
Giles Joseph F and Giles Sue
Bought by
Giles Joseph F and Giles Sue Ellen
Purchase Details
Closed on
May 5, 1998
Sold by
Pugh Kayleen
Bought by
Western Marc F
Home Financials for this Owner
Home Financials are based on the most recent Mortgage that was taken out on this home.
Original Mortgage
$160,800
Interest Rate
7.05%
Create a Home Valuation Report for This Property
The Home Valuation Report is an in-depth analysis detailing your home's value as well as a comparison with similar homes in the area
Home Values in the Area
Average Home Value in this Area
Purchase History
| Date | Buyer | Sale Price | Title Company |
|---|---|---|---|
| Giles Joseph | -- | Vanguard Title Ins Agcy | |
| Giles Joseph F | -- | None Available | |
| Western Marc F | -- | -- | |
| Pugh Kayleen | -- | -- |
Source: Public Records
Mortgage History
| Date | Status | Borrower | Loan Amount |
|---|---|---|---|
| Open | Giles Joseph | $174,950 | |
| Closed | Western Marc F | $160,800 |
Source: Public Records
Tax History Compared to Growth
Tax History
| Year | Tax Paid | Tax Assessment Tax Assessment Total Assessment is a certain percentage of the fair market value that is determined by local assessors to be the total taxable value of land and additions on the property. | Land | Improvement |
|---|---|---|---|---|
| 2025 | $4,089 | $730,900 | $303,200 | $427,700 |
| 2024 | $4,089 | $707,800 | $294,600 | $413,200 |
| 2023 | $4,166 | $679,700 | $288,800 | $390,900 |
| 2022 | $4,340 | $694,700 | $283,100 | $411,600 |
| 2021 | $3,748 | $534,200 | $240,000 | $294,200 |
| 2020 | $46 | $469,000 | $238,800 | $230,200 |
| 2019 | $3,484 | $455,100 | $235,100 | $220,000 |
| 2018 | $3,306 | $425,200 | $149,600 | $275,600 |
| 2017 | $3,206 | $401,800 | $149,600 | $252,200 |
| 2016 | $3,109 | $373,900 | $149,600 | $224,300 |
| 2015 | $3,073 | $358,300 | $171,300 | $187,000 |
| 2014 | $2,903 | $331,900 | $160,300 | $171,600 |
Source: Public Records
Map
Nearby Homes
- 1184 W Margaret Rose Dr
- 1182 River Hills Dr
- 12091 S Lampton View Dr
- 11860 S Alysum Cir
- 1337 Natasha Cir
- 12216 S 1300 W
- 1410 W 12115 S
- 11784 Stone Ridge Ct
- 12392 S 1300 W
- 11664 S Lampton View Dr
- 12294 S 1490 W
- 11697 Tattered Angel Cove
- 11711 Stone Crest Cir
- 11622 S Halcom Dr Unit 601
- 12566 S Tithing Hill Dr
- 11606 S Halcom Dr
- 11694 Stone Crest Cir
- 1233 W 12500 S
- 1611 W Laurel Chase Dr
- 1182 Country Ridge Dr
- 1201 Sirmingo Way
- 12069 Kandi Cir
- 12064 Fastback Cir
- 12074 Fastback Cir
- 12074 S Fastback Cir
- 12072 Kandi Cir
- 1168 Sirmingo Way
- 1168 W Sirmingo Way
- 12052 S Kandi Cir
- 12052 Kandi Cir
- 1222 Sirmingo Way
- 1166 Margaret Rose Dr
- 12062 Kandi Cir
- 12062 S Kandi Cir
- 1184 Margaret Rose Dr
- 1204 Margaret Rose Dr
- 1154 W Sirmingo Way
- 1154 Sirmingo Way
- 12075 Fastback Cir
- 12057 S Fastback Cir