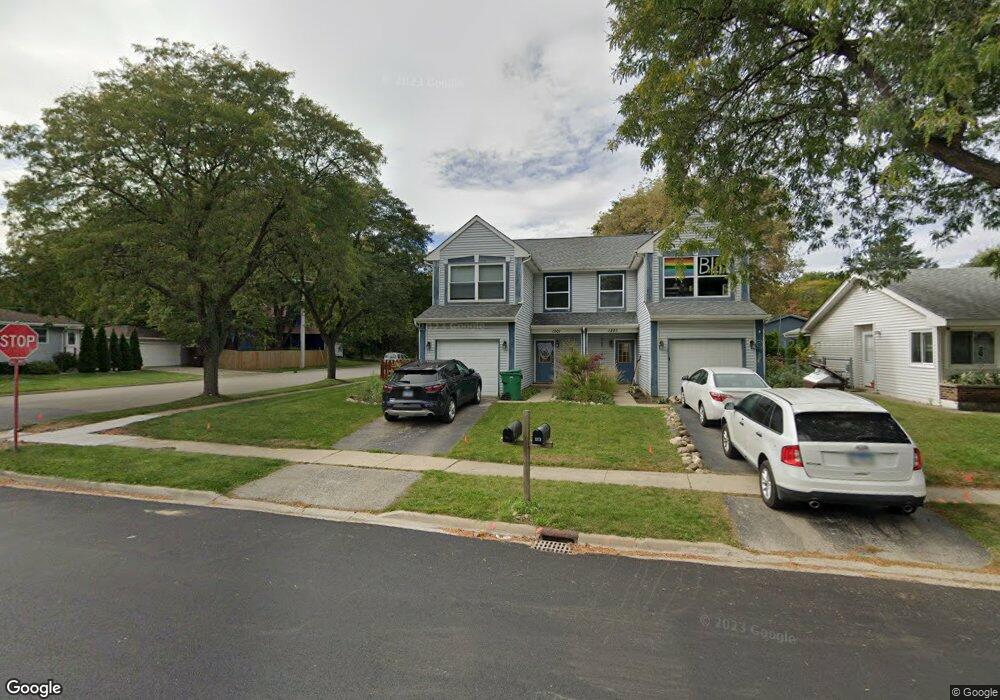
1201 Wicker St Woodstock, IL 60098
Estimated Value: $198,000 - $238,000
2
Beds
2
Baths
1,240
Sq Ft
$173/Sq Ft
Est. Value
About This Home
This home is located at 1201 Wicker St, Woodstock, IL 60098 and is currently estimated at $214,210, approximately $172 per square foot. 1201 Wicker St is a home located in McHenry County with nearby schools including Westwood Elementary School, Northwood Middle School, and Woodstock North High School.
Ownership History
Date
Name
Owned For
Owner Type
Purchase Details
Closed on
Jun 17, 2020
Sold by
Hagen Kimberly and Hagen Scott
Bought by
Hagen Scott and Hagen Kimberly
Current Estimated Value
Home Financials for this Owner
Home Financials are based on the most recent Mortgage that was taken out on this home.
Original Mortgage
$89,900
Outstanding Balance
$63,199
Interest Rate
3.2%
Mortgage Type
New Conventional
Estimated Equity
$151,011
Purchase Details
Closed on
Jul 26, 2004
Sold by
Ennis Shannie M
Bought by
Schmitt Kimberly
Home Financials for this Owner
Home Financials are based on the most recent Mortgage that was taken out on this home.
Original Mortgage
$132,405
Interest Rate
6.42%
Mortgage Type
Purchase Money Mortgage
Purchase Details
Closed on
Mar 27, 2002
Sold by
Amcore Investment Group Na
Bought by
Ennis Shannie M
Home Financials for this Owner
Home Financials are based on the most recent Mortgage that was taken out on this home.
Original Mortgage
$115,400
Interest Rate
6.87%
Create a Home Valuation Report for This Property
The Home Valuation Report is an in-depth analysis detailing your home's value as well as a comparison with similar homes in the area
Home Values in the Area
Average Home Value in this Area
Purchase History
| Date | Buyer | Sale Price | Title Company |
|---|---|---|---|
| Hagen Scott | -- | Mortgage Information Svcs In | |
| Schmitt Kimberly | $136,500 | Multiple | |
| Ennis Shannie M | $119,000 | Chicago Title Insurance Co |
Source: Public Records
Mortgage History
| Date | Status | Borrower | Loan Amount |
|---|---|---|---|
| Open | Hagen Scott | $89,900 | |
| Closed | Schmitt Kimberly | $132,405 | |
| Previous Owner | Ennis Shannie M | $115,400 |
Source: Public Records
Tax History Compared to Growth
Tax History
| Year | Tax Paid | Tax Assessment Tax Assessment Total Assessment is a certain percentage of the fair market value that is determined by local assessors to be the total taxable value of land and additions on the property. | Land | Improvement |
|---|---|---|---|---|
| 2024 | $5,067 | $54,470 | $9,302 | $45,168 |
| 2023 | $4,923 | $49,813 | $8,507 | $41,306 |
| 2022 | $3,993 | $38,265 | $7,644 | $30,621 |
| 2021 | $3,807 | $35,602 | $7,112 | $28,490 |
| 2020 | $3,022 | $33,755 | $6,743 | $27,012 |
| 2019 | $2,875 | $31,782 | $6,349 | $25,433 |
| 2018 | $2,701 | $29,817 | $5,956 | $23,861 |
| 2017 | $2,619 | $27,984 | $5,590 | $22,394 |
| 2016 | $2,603 | $26,271 | $5,248 | $21,023 |
| 2013 | -- | $26,028 | $5,200 | $20,828 |
Source: Public Records
Map
Nearby Homes
- 740 Victoria Dr
- 320 W Donovan Ave
- 208 W Greenwood Ave
- 814 Robert Dr
- 1026 Clay St
- 1546 Wheeler St
- 724 Wheeler St
- 824 Washington St
- 1626 Wheeler St
- 0 Rt 47 & Lucas Rd Unit MRD12293021
- 150 1st St
- 431 Washington St
- 1409 N Seminary Ave
- 1891 Wicker St Unit 3
- 920 Pleasant St
- Lots 8 & 9 Greenwood Cir
- 233 Arthur Dr
- 244 Joseph St
- 13808 Washington St
- Block 153 Joseph St
- 1203 Wicker St
- 1213 Wicker St
- 1215 Wicker St
- 1139 Wicker St
- 1202 Thomas Dr Unit 1
- 1216 Thomas Dr
- 1225 Wicker St
- 1226 Thomas Dr
- 1133 Wicker St
- 520 W Greenwood Ave
- 617 W Greenwood Ave
- 1228 Thomas Dr
- 1206 Wicker St
- 1237 Wicker St Unit 1239
- 519 W Greenwood Ave
- 1216 Wicker St
- 1238 Thomas Dr Unit 1240
- 1130 Wicker St
- 1117 Wicker St
- 1249 Wicker St