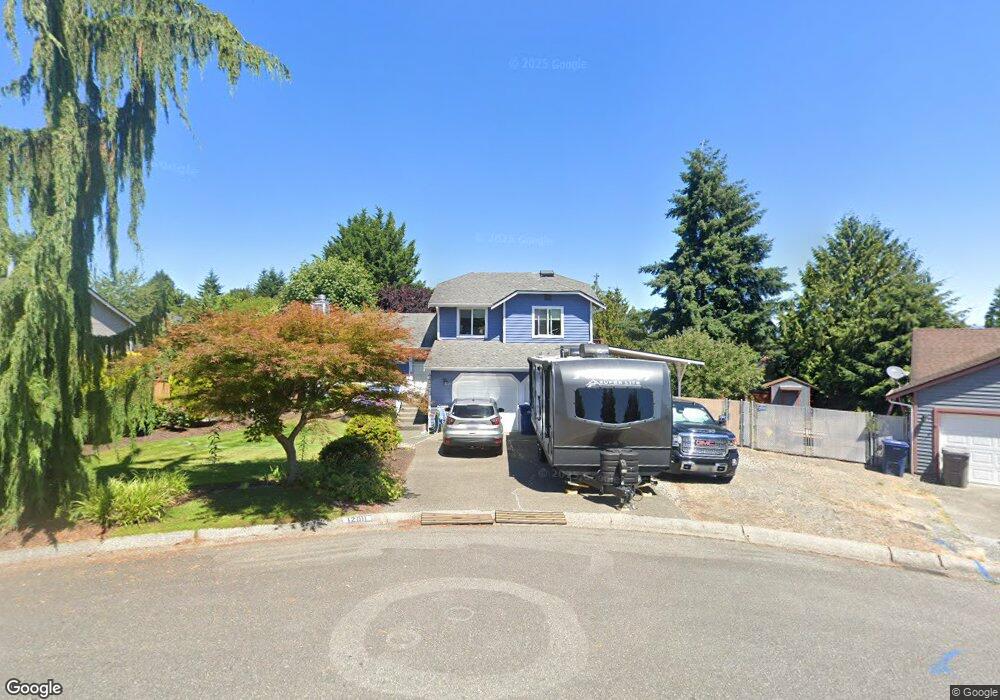
12011 28th Place NE Lake Stevens, WA 98258
Old Town Lake Stevens NeighborhoodEstimated Value: $634,000 - $718,000
3
Beds
3
Baths
1,523
Sq Ft
$440/Sq Ft
Est. Value
About This Home
This home is located at 12011 28th Place NE, Lake Stevens, WA 98258 and is currently estimated at $670,235, approximately $440 per square foot. 12011 28th Place NE is a home located in Snohomish County with nearby schools including Highland Elementary School, North Lake Middle School, and Cavelero Mid High School.
Ownership History
Date
Name
Owned For
Owner Type
Purchase Details
Closed on
Dec 8, 2003
Sold by
Burch James M and Burch Kathryn Jane
Bought by
Davis Steven D and Davis Jennifer M
Current Estimated Value
Home Financials for this Owner
Home Financials are based on the most recent Mortgage that was taken out on this home.
Original Mortgage
$172,080
Outstanding Balance
$79,961
Interest Rate
5.92%
Mortgage Type
Purchase Money Mortgage
Estimated Equity
$590,274
Purchase Details
Closed on
May 9, 2002
Sold by
Tallman Kenneth Merwyn and Tallman Elaine Jeanette
Bought by
Burch James M and Burch Kathryn Jane
Home Financials for this Owner
Home Financials are based on the most recent Mortgage that was taken out on this home.
Original Mortgage
$144,000
Interest Rate
6.12%
Purchase Details
Closed on
Aug 3, 1995
Sold by
Tallman Kenneth Merwyn and Tallman Elaine Jeanette
Bought by
Tallman Kenneth Merwyn and Tallman Elaine Jeanette
Create a Home Valuation Report for This Property
The Home Valuation Report is an in-depth analysis detailing your home's value as well as a comparison with similar homes in the area
Home Values in the Area
Average Home Value in this Area
Purchase History
| Date | Buyer | Sale Price | Title Company |
|---|---|---|---|
| Davis Steven D | $215,100 | Commonwealth Land Title | |
| Burch James M | $192,000 | Transnation Title Insurance | |
| Tallman Kenneth Merwyn | -- | -- |
Source: Public Records
Mortgage History
| Date | Status | Borrower | Loan Amount |
|---|---|---|---|
| Open | Davis Steven D | $172,080 | |
| Previous Owner | Burch James M | $144,000 | |
| Closed | Davis Steven D | $21,510 |
Source: Public Records
Tax History Compared to Growth
Tax History
| Year | Tax Paid | Tax Assessment Tax Assessment Total Assessment is a certain percentage of the fair market value that is determined by local assessors to be the total taxable value of land and additions on the property. | Land | Improvement |
|---|---|---|---|---|
| 2025 | $5,209 | $614,900 | $344,000 | $270,900 |
| 2024 | $5,209 | $559,700 | $304,000 | $255,700 |
| 2023 | $5,008 | $583,000 | $315,000 | $268,000 |
| 2022 | $4,640 | $445,600 | $230,000 | $215,600 |
| 2020 | $4,227 | $379,600 | $195,000 | $184,600 |
| 2019 | $3,926 | $346,500 | $175,000 | $171,500 |
| 2018 | $3,807 | $310,000 | $149,000 | $161,000 |
| 2017 | $3,013 | $276,700 | $127,000 | $149,700 |
| 2016 | $3,038 | $259,600 | $114,000 | $145,600 |
| 2015 | $3,017 | $239,400 | $101,000 | $138,400 |
| 2013 | $2,836 | $197,300 | $85,000 | $112,300 |
Source: Public Records
Map
Nearby Homes
- 12101 30th St NE
- 12203 30th St NE
- 2311 116th Ave NE
- 11416 33rd St NE
- 11608 34th St NE
- 12104 22nd St NE
- 11305 31st Place NE
- 12829 27th Place NE
- 12004 22nd St NE
- 2004 120th Ave SE
- 2215 116th Ave NE
- 11335 36th St NE
- 12006 20th St NE
- 12611 37th Place NE
- 3606 114th Ct NE
- 11413 20th St NE Unit 5
- The Ivy – Design A Plan at Centennial Townhomes
- The Ivy – Design B Plan at Centennial Townhomes
- 13107 21st Ct NE
- 12203 N Lakeshore Dr
- 12009 28th Place NE
- 12013 28th Place NE
- 12012 29th Place NE
- 12012 29th Place NE
- 12010 29th Place NE
- 12007 28th Place NE
- 12015 28th Place NE
- 1826 111th Se #56 Dr
- 91 XX 12x Ave NE
- 102 XX 32nd St NE
- 0 L3,4 20th (Bus Loop) St NE
- 0 LOT23 115th Ave NE
- 0 LOT 29 115th Ave NE
- 0 LOT 32 115th Ave NE
- 0 LOT26 115th Ave NE
- 0 LOT 33 115th Ave NE
- 0 LOT 34 115th Ave NE
- 0 LOT 31 115th Ave NE
- 0 LOT 27 115th Ave NE
- 0 LOT 28 115th Ave NE