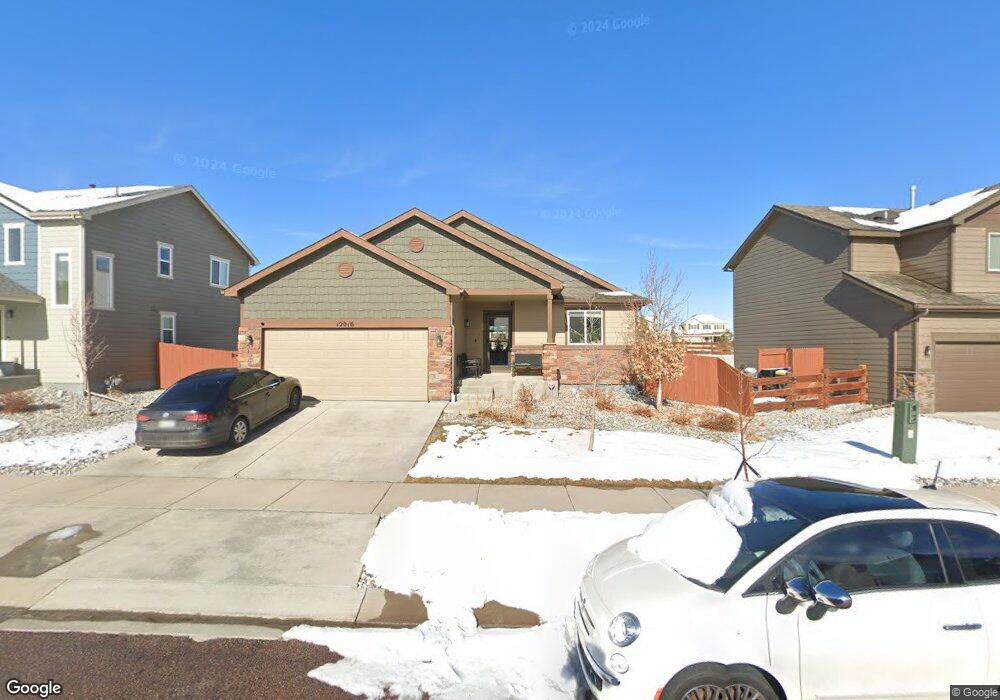
12016 Eagle Crest Ct Peyton, CO 80831
Falcon NeighborhoodEstimated Value: $462,000 - $524,000
4
Beds
3
Baths
1,272
Sq Ft
$379/Sq Ft
Est. Value
About This Home
This home is located at 12016 Eagle Crest Ct, Peyton, CO 80831 and is currently estimated at $481,770, approximately $378 per square foot. 12016 Eagle Crest Ct is a home located in El Paso County with nearby schools including Woodmen Hills Elementary School, Falcon Middle School, and Falcon High School.
Ownership History
Date
Name
Owned For
Owner Type
Purchase Details
Closed on
Jun 2, 2021
Sold by
Gentry Jason D and Gentry Whitney C
Bought by
Warren Randy Dylan and Ewers Allie Brooke
Current Estimated Value
Home Financials for this Owner
Home Financials are based on the most recent Mortgage that was taken out on this home.
Original Mortgage
$399,000
Outstanding Balance
$361,245
Interest Rate
2.9%
Mortgage Type
New Conventional
Estimated Equity
$120,525
Purchase Details
Closed on
Jul 30, 2018
Sold by
Savory David
Bought by
Gentry Jason D and Gentry Whitney C
Home Financials for this Owner
Home Financials are based on the most recent Mortgage that was taken out on this home.
Original Mortgage
$326,400
Interest Rate
4.5%
Mortgage Type
VA
Purchase Details
Closed on
Mar 28, 2016
Sold by
Saint Aubyn Homes Llc
Bought by
Savory David
Home Financials for this Owner
Home Financials are based on the most recent Mortgage that was taken out on this home.
Original Mortgage
$260,627
Interest Rate
3.5%
Mortgage Type
FHA
Create a Home Valuation Report for This Property
The Home Valuation Report is an in-depth analysis detailing your home's value as well as a comparison with similar homes in the area
Home Values in the Area
Average Home Value in this Area
Purchase History
| Date | Buyer | Sale Price | Title Company |
|---|---|---|---|
| Warren Randy Dylan | $420,000 | Legacy Title Group Llc | |
| Gentry Jason D | $326,400 | Chicago Title | |
| Savory David | $265,400 | Heritage Title |
Source: Public Records
Mortgage History
| Date | Status | Borrower | Loan Amount |
|---|---|---|---|
| Open | Warren Randy Dylan | $399,000 | |
| Previous Owner | Gentry Jason D | $326,400 | |
| Previous Owner | Savory David | $260,627 |
Source: Public Records
Tax History
| Year | Tax Paid | Tax Assessment Tax Assessment Total Assessment is a certain percentage of the fair market value that is determined by local assessors to be the total taxable value of land and additions on the property. | Land | Improvement |
|---|---|---|---|---|
| 2025 | $3,119 | $33,440 | -- | -- |
| 2024 | $2,994 | $34,210 | $6,420 | $27,790 |
| 2022 | $2,391 | $23,690 | $5,020 | $18,670 |
| 2021 | $2,479 | $24,380 | $5,170 | $19,210 |
| 2020 | $2,501 | $22,810 | $4,680 | $18,130 |
| 2019 | $2,487 | $22,810 | $4,680 | $18,130 |
| 2018 | $2,078 | $18,860 | $4,280 | $14,580 |
| 2017 | $1,965 | $18,860 | $4,280 | $14,580 |
| 2016 | $646 | $6,350 | $4,740 | $1,610 |
| 2015 | $320 | $3,140 | $3,140 | $0 |
Source: Public Records
Map
Nearby Homes
- 12113 Eagle Crest Ct
- 10025 Beryl Dr
- 11908 Eagle Crest Ct
- 9385 Winged Foot Rd
- 9880 Everglades Dr
- 9881 Everglades Dr
- 9863 Walnut Canyon Dr
- 12216 Chimney Smoke Dr
- 9188 Sunningdale Rd
- 12256 Chimney Smoke Dr
- 9187 Royal Melbourne Cir
- 12144 Point Reyes Dr
- 11650 Cranston Dr
- 9202 Ballybunion Rd
- 9201 Ballybunion Rd
- 12252 Point Reyes Dr
- 9052 Sunningdale Rd
- 9333 Bethpage Rd
- 10135 Kings Canyon Dr
- 10342 Biscayne Dr
- 12004 Eagle Crest Ct
- 12040 Eagle Crest Ct
- 11992 Eagle Crest Ct
- 12052 Eagle Crest Ct
- 11980 Eagle Crest Ct
- 12017 Eagle Crest Ct
- 12064 Eagle Crest Ct
- 12053 Eagle Crest Ct
- 12029 Eagle Crest Ct
- 12005 Eagle Crest Ct
- 11993 Eagle Crest Ct
- 11981 Eagle Crest Ct
- 9624 Beryl Dr
- 12065 Eagle Crest Ct
- 9630 Beryl Dr
- 9498 Beryl Dr
- 11969 Eagle Crest Ct
- 11944 Eagle Crest Ct
- 9492 Beryl Dr
- 9636 Beryl Dr
Your Personal Tour Guide
Ask me questions while you tour the home.