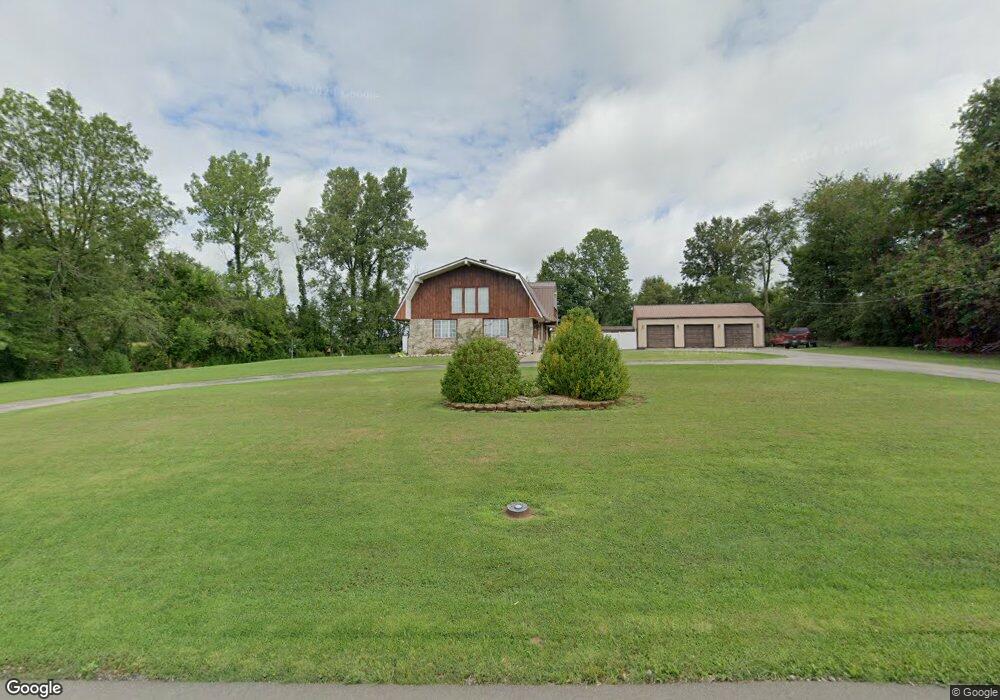
12018 W 300 N Linton, IN 47441
Estimated Value: $246,801 - $309,000
3
Beds
2
Baths
2,414
Sq Ft
$118/Sq Ft
Est. Value
About This Home
This home is located at 12018 W 300 N, Linton, IN 47441 and is currently estimated at $285,700, approximately $118 per square foot. 12018 W 300 N is a home located in Greene County with nearby schools including Linton-Stockton Elementary School, Linton-Stockton Junior High School, and Linton-Stockton High School.
Ownership History
Date
Name
Owned For
Owner Type
Purchase Details
Closed on
Mar 14, 2014
Sold by
Hauser Ricky D
Bought by
Brown Richard L and Phegley Timmy Ray
Current Estimated Value
Home Financials for this Owner
Home Financials are based on the most recent Mortgage that was taken out on this home.
Original Mortgage
$143,565
Outstanding Balance
$108,610
Interest Rate
4.29%
Mortgage Type
New Conventional
Estimated Equity
$177,090
Purchase Details
Closed on
Dec 2, 2013
Sold by
Hauser Ricky D and Hauser Mary Susan
Bought by
Hauser Ricky D
Create a Home Valuation Report for This Property
The Home Valuation Report is an in-depth analysis detailing your home's value as well as a comparison with similar homes in the area
Home Values in the Area
Average Home Value in this Area
Purchase History
| Date | Buyer | Sale Price | Title Company |
|---|---|---|---|
| Brown Richard L | -- | Chicago Title | |
| Hauser Ricky D | -- | None Available |
Source: Public Records
Mortgage History
| Date | Status | Borrower | Loan Amount |
|---|---|---|---|
| Open | Brown Richard L | $143,565 |
Source: Public Records
Tax History Compared to Growth
Tax History
| Year | Tax Paid | Tax Assessment Tax Assessment Total Assessment is a certain percentage of the fair market value that is determined by local assessors to be the total taxable value of land and additions on the property. | Land | Improvement |
|---|---|---|---|---|
| 2024 | $1,454 | $142,000 | $15,300 | $126,700 |
| 2023 | $1,524 | $149,000 | $15,300 | $133,700 |
| 2022 | $1,726 | $153,300 | $15,300 | $138,000 |
| 2021 | $1,544 | $141,800 | $15,300 | $126,500 |
| 2020 | $1,532 | $141,800 | $15,300 | $126,500 |
| 2019 | $1,455 | $134,100 | $15,300 | $118,800 |
| 2018 | $1,570 | $137,800 | $15,300 | $122,500 |
| 2017 | $1,542 | $136,400 | $15,300 | $121,100 |
| 2016 | $1,569 | $137,300 | $15,300 | $122,000 |
| 2014 | $1,400 | $138,400 | $15,300 | $123,100 |
| 2013 | -- | $139,900 | $15,300 | $124,600 |
Source: Public Records
Map
Nearby Homes