Estimated Value: $429,000 - $483,000
3
Beds
3
Baths
1,650
Sq Ft
$277/Sq Ft
Est. Value
About This Home
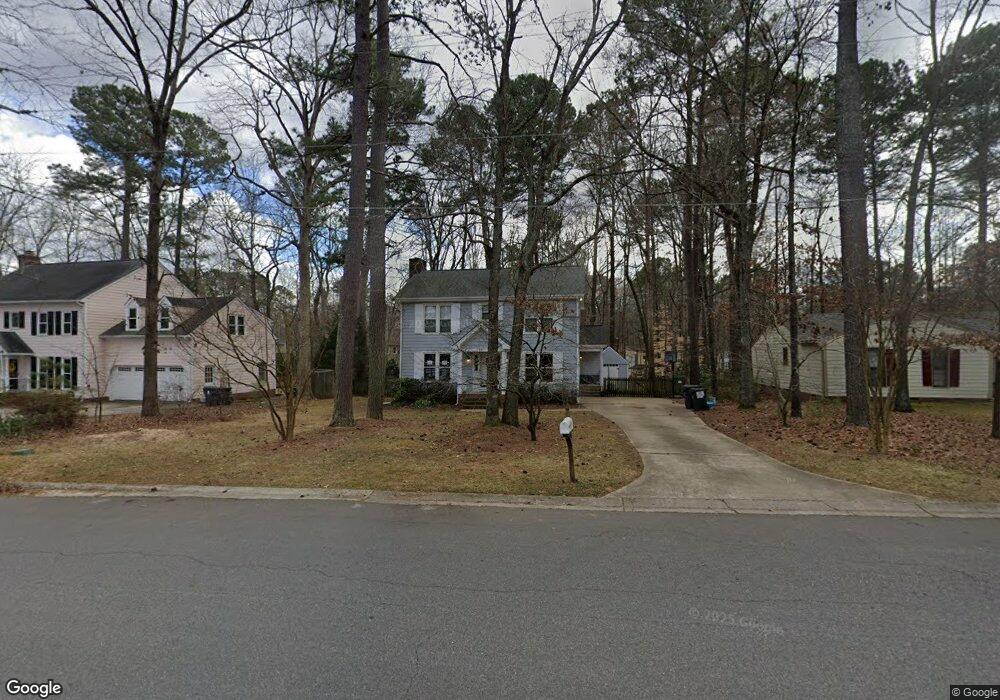
This home is located at 1202 Apache Ln, Apex, NC 27502 and is currently estimated at $457,861, approximately $277 per square foot. 1202 Apache Ln is a home located in Wake County with nearby schools including Apex Elementary School, Apex Middle, and Apex High School.
Ownership History
Date
Name
Owned For
Owner Type
Purchase Details
Closed on
Dec 29, 2014
Sold by
Nashland Steven L and Nashland Carmen L
Bought by
Cortright Catherine L and Cortright Daniel T
Current Estimated Value
Home Financials for this Owner
Home Financials are based on the most recent Mortgage that was taken out on this home.
Original Mortgage
$214,515
Outstanding Balance
$165,692
Interest Rate
4.07%
Mortgage Type
VA
Estimated Equity
$292,169
Purchase Details
Closed on
Jul 10, 2006
Sold by
Barefoot James R and Barefoot Amy W
Bought by
Nashland Steven L and Nashland Carmen L
Home Financials for this Owner
Home Financials are based on the most recent Mortgage that was taken out on this home.
Original Mortgage
$146,400
Interest Rate
6.17%
Mortgage Type
Purchase Money Mortgage
Create a Home Valuation Report for This Property
The Home Valuation Report is an in-depth analysis detailing your home's value as well as a comparison with similar homes in the area
Purchase History
| Date | Buyer | Sale Price | Title Company |
|---|---|---|---|
| Cortright Catherine L | $210,000 | None Available | |
| Nashland Steven L | $183,000 | None Available |
Source: Public Records
Mortgage History
| Date | Status | Borrower | Loan Amount |
|---|---|---|---|
| Open | Cortright Catherine L | $214,515 | |
| Previous Owner | Nashland Steven L | $146,400 | |
| Previous Owner | Nashland Steven L | $18,300 |
Source: Public Records
Tax History
| Year | Tax Paid | Tax Assessment Tax Assessment Total Assessment is a certain percentage of the fair market value that is determined by local assessors to be the total taxable value of land and additions on the property. | Land | Improvement |
|---|---|---|---|---|
| 2025 | $3,647 | $415,415 | $200,000 | $215,415 |
| 2024 | $3,566 | $415,415 | $200,000 | $215,415 |
Source: Public Records
Map
Nearby Homes
- 1200 Boxwood Ln
- 119 Heatherwood Dr
- 201 Pinewood Dr
- 345 Great Northern Station
- 1000 Chimney Hill Dr
- 2361 Englemann Dr
- 2374 Englemann Dr
- 2350 Englemann Dr
- 2377 Englemann Dr
- 2357 Englemann Dr
- 2369 Englemann Dr
- 2373 Englemann Dr
- 2365 Englemann Dr
- 3123 June Lake Station
- 2354 Englemann Dr
- 2370 Englemann Dr
- 596 Grand Central Station
- 610 Metro Station
- 1124 Platform Dr
- 1115 Platform Dr
- 1204 Apache Ln
- 1200 Apache Ln
- 1206 Apache Ln
- 1207 Indian Trail
- 1104 Apache Ln
- 1000 Cherokee Ct
- 1205 Indian Trail
- 1010 Lindfield Ct
- 1306 Eastham Dr
- 1208 Apache Ln
- 1008 Lindfield Ct
- 1203 Indian Trail
- 1209 Indian Trail
- 1102 Apache Ln
- 1002 Cherokee Ct
- 1012 Lindfield Ct
- 1001 Cherokee Ct
- 1304 Eastham Dr
- 1006 Lindfield Ct
- 1002 Lindfield Ct
Your Personal Tour Guide
Ask me questions while you tour the home.