Estimated payment $2,230/month
Total Views
382
1
Acre
$399,900
Price per Acre
43,560
Sq Ft Lot
About This Lot
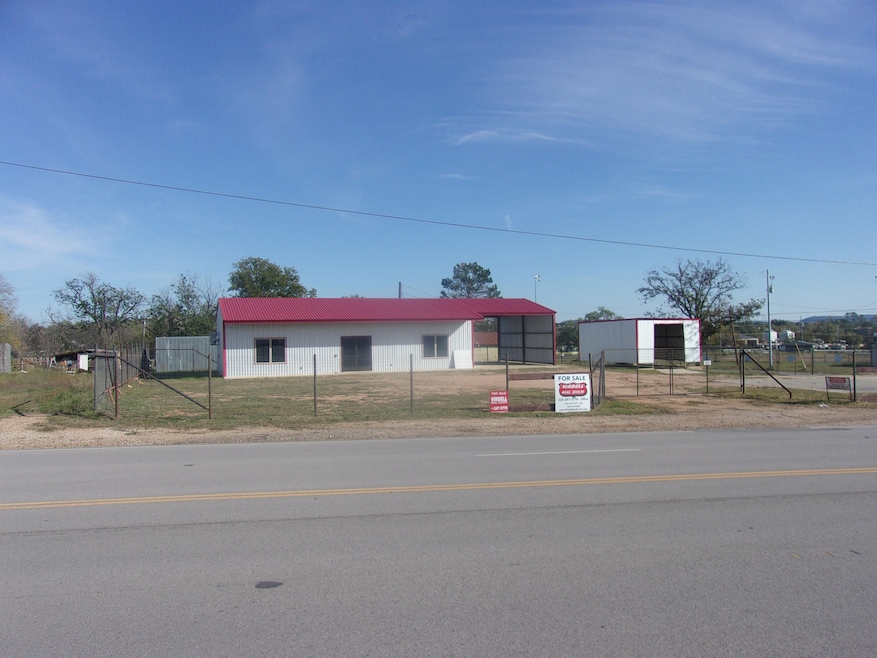
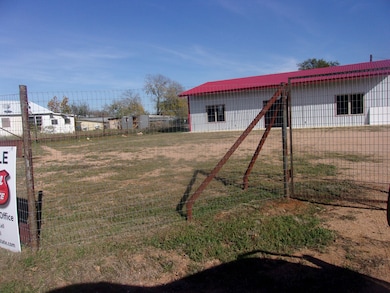
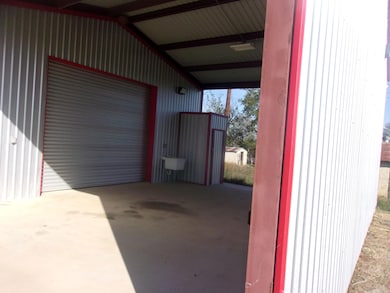
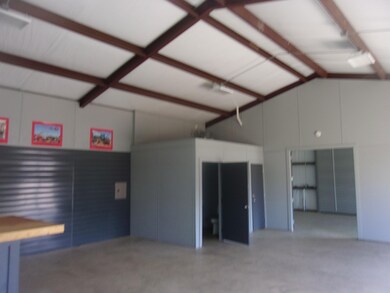
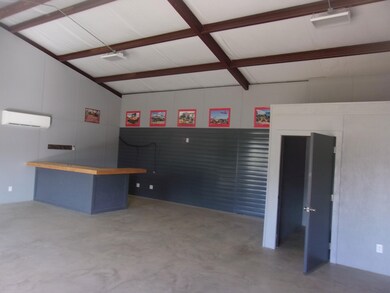
GREAT EXPOSURE ON HIGHWAY 16 NORTH OF LLANO, SPACIOUS METAL 2 ROOM BUILDING THAT COULD BE ANY TYPE OF BUSINESS, ALL FENCED, PLENTY OF PARKING, THE SIZE OF LAND AND AMOUNT OF ACREAGE IS ONLY AN ESTIMATE, NEEDS A NEW SURVEY.
Listing Provided By

Property Details
Property Type
- Land
Est. Annual Taxes
- $1,467
Lot Details
- Property fronts a highway
- Chain Link Fence
- Perimeter Fence
- Corner Lot
- Current uses include commercial
- Potential uses include commercial
Home Design
- Slab Foundation
- Metal Roof
Additional Features
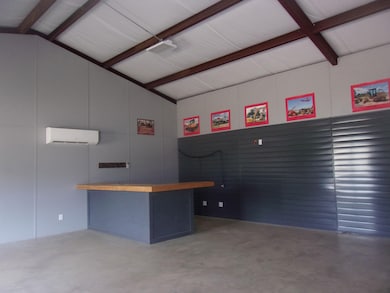
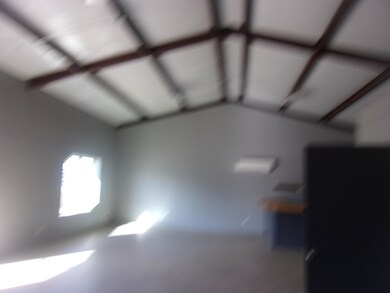
- Concrete Flooring
- Window Unit Cooling System
Map
Create a Home Valuation Report for This Property
The Home Valuation Report is an in-depth analysis detailing your home's value as well as a comparison with similar homes in the area
Home Values in the Area
Average Home Value in this Area
Tax History
| Year | Tax Paid | Tax Assessment Tax Assessment Total Assessment is a certain percentage of the fair market value that is determined by local assessors to be the total taxable value of land and additions on the property. | Land | Improvement |
|---|---|---|---|---|
| 2024 | $1,467 | $96,430 | $21,740 | $74,690 |
| 2023 | $1,534 | $95,390 | $20,700 | $74,690 |
| 2022 | $1,682 | $95,390 | $20,700 | $74,690 |
| 2021 | $1,821 | $91,870 | $17,180 | $74,690 |
| 2020 | $1,854 | $88,730 | $17,180 | $71,550 |
| 2019 | $999 | $46,840 | $17,180 | $29,660 |
| 2018 | $1,008 | $46,060 | $17,180 | $28,880 |
| 2017 | $865 | $45,800 | $17,180 | $28,620 |
| 2016 | $838 | $44,390 | $17,180 | $27,210 |
| 2015 | -- | $44,390 | $17,180 | $27,210 |
| 2014 | -- | $44,390 | $17,180 | $27,210 |
Source: Public Records
Property History
| Date | Event | Price | List to Sale | Price per Sq Ft |
|---|---|---|---|---|
| 08/12/2025 08/12/25 | Price Changed | $399,900 | -10.9% | -- |
| 04/24/2025 04/24/25 | Price Changed | $449,000 | -5.5% | -- |
| 12/05/2023 12/05/23 | For Sale | $475,000 | -- | -- |
Nearby Homes
- 103 E Houston St
- 1010 Bessemer Ave
- 103 W Hamilton St
- oo E Navarro St
- 309 E Navarro St
- 21317 Fm 2323
- 7201 Fm 2241
- Lot 11 Cr 104
- 302 E Hamilton St
- 13315 Texas Highway 16
- 5830 Texas Highway 16
- 0 Anniston Ave
- 000 Texas 29
- 4536 Texas 29
- 1108 Ashley Ave
- 509 E Austin St
- 1109 Ashley Ave
- 609 W Leon St
- 305 W Tarrant St
- 0 E Tarrant St Unit HLM175591
- 801 W Navarro St
- 408 W Luce St
- 6552 Co Rd 403
- 6552 Cr 403
- 12041-108 W Ranch Rd 152 Unit ID1262281P
- 278 Valley Ranch Rd
- 106 Logan Dr
- 109 Logan Dr
- 1504 - 3 Rr 261
- 1504 Rr 261
- 919 Austin St
- 209 Crest Dr
- 17809 Tx-29 Unit 17809
- 689 Beaver St
- 161 Alexander Dr Unit 8
- 161 Alexander Dr Unit 1
- 513 Co Rd 219a Unit The Hideaway
- 515 Co Rd 219a Unit The Getaway
- 2001 Cedar Park
- 1617 Cascade