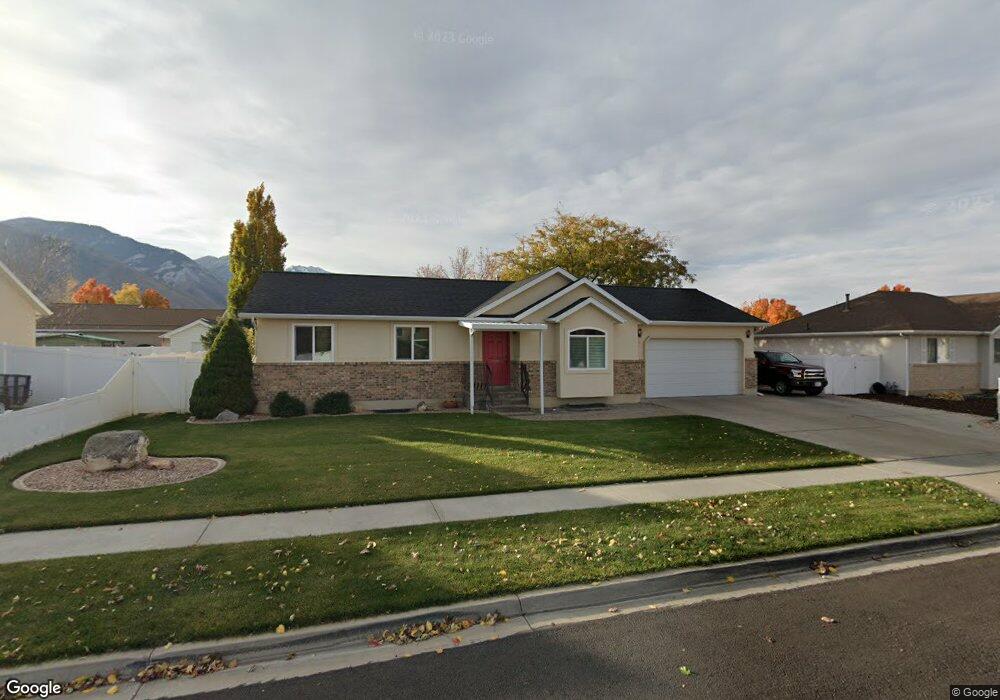
1202 E 1520 S Spanish Fork, UT 84660
Estimated Value: $489,000 - $540,000
3
Beds
2
Baths
2,528
Sq Ft
$205/Sq Ft
Est. Value
About This Home
This home is located at 1202 E 1520 S, Spanish Fork, UT 84660 and is currently estimated at $518,108, approximately $204 per square foot. 1202 E 1520 S is a home located in Utah County with nearby schools including Canyon Elementary School, Spanish Fork Jr High School, and Spanish Fork High School.
Ownership History
Date
Name
Owned For
Owner Type
Purchase Details
Closed on
Dec 23, 2008
Sold by
Rasmussen Kay and Rasmussen Sandra
Bought by
Rasmussen Kay T and Rasmussen Sandra D
Current Estimated Value
Home Financials for this Owner
Home Financials are based on the most recent Mortgage that was taken out on this home.
Original Mortgage
$213,693
Outstanding Balance
$140,505
Interest Rate
6.03%
Mortgage Type
FHA
Estimated Equity
$377,603
Purchase Details
Closed on
Mar 23, 1999
Sold by
Kirk Rodney L
Bought by
Rasmussen Kay and Rasmussen Sandra
Home Financials for this Owner
Home Financials are based on the most recent Mortgage that was taken out on this home.
Original Mortgage
$136,500
Interest Rate
6.73%
Purchase Details
Closed on
Mar 1, 1999
Sold by
Maddi Corp Inc
Bought by
Kirk Rodney
Home Financials for this Owner
Home Financials are based on the most recent Mortgage that was taken out on this home.
Original Mortgage
$136,500
Interest Rate
6.73%
Purchase Details
Closed on
Jan 12, 1999
Sold by
Maddi Corp Inc
Bought by
Smith James Lavea
Create a Home Valuation Report for This Property
The Home Valuation Report is an in-depth analysis detailing your home's value as well as a comparison with similar homes in the area
Home Values in the Area
Average Home Value in this Area
Purchase History
| Date | Buyer | Sale Price | Title Company |
|---|---|---|---|
| Rasmussen Kay T | -- | Wasatch Land & Title | |
| Rasmussen Kay | -- | Wasatch Land & Title | |
| Kirk Rodney | -- | Wasatch Land & Title | |
| Smith James Lavea | -- | Wasatch Land & Title |
Source: Public Records
Mortgage History
| Date | Status | Borrower | Loan Amount |
|---|---|---|---|
| Open | Rasmussen Kay T | $213,693 | |
| Previous Owner | Rasmussen Kay | $136,500 |
Source: Public Records
Tax History Compared to Growth
Tax History
| Year | Tax Paid | Tax Assessment Tax Assessment Total Assessment is a certain percentage of the fair market value that is determined by local assessors to be the total taxable value of land and additions on the property. | Land | Improvement |
|---|---|---|---|---|
| 2025 | $2,167 | $247,115 | $186,300 | $263,000 |
| 2024 | $2,167 | $223,355 | $0 | $0 |
| 2023 | $2,178 | $224,785 | $0 | $0 |
| 2022 | $2,331 | $235,895 | $0 | $0 |
| 2021 | $1,976 | $320,000 | $111,200 | $208,800 |
| 2020 | $1,837 | $289,200 | $101,100 | $188,100 |
| 2019 | $1,672 | $276,900 | $95,500 | $181,400 |
| 2018 | $1,554 | $248,700 | $88,400 | $160,300 |
| 2017 | $1,366 | $117,535 | $0 | $0 |
| 2016 | $1,234 | $104,775 | $0 | $0 |
| 2015 | $1,249 | $104,775 | $0 | $0 |
| 2014 | $1,244 | $104,720 | $0 | $0 |
Source: Public Records
Map
Nearby Homes
- 1522 S 1100 E
- 1341 E 1670 S Unit 819
- 1333 E 1670 S Unit 816
- 1339 E 1670 S Unit 818
- 1334 E 1670 S Unit 822
- 1296 E 1670 S Unit 910
- 1336 E 1670 S Unit 821
- 1337 E 1670 S Unit 817
- 1338 E 1670 S Unit 820
- 1332 E 1670 S Unit 823
- 1298 E 1670 S Unit 909
- 1380 S 980 E
- 1591 E 1550 S
- 1110 E 1025 S
- 357 E 1460 S Unit 45
- 385 E 1460 S Unit 47
- 379 E 1460 S Unit 46
- 1112 S 1660 E
- 1033 S 1560 E
- 929 S 900 E
- 1228 E 1520 S
- 1178 E 1520 S
- 1203 E 1570 S
- 1227 E 1570 S
- 1547 S 1170 E
- 1181 E 1520 S
- 1207 E 1520 S
- 1207 E 1520 S Unit 2
- 1246 E 1520 S
- 1231 E 1520 S
- 1515 S 1170 E
- 8 E 1570 St S Unit LOT 8
- 1233 E 1570 S
- 1094 E 1570 St S
- 1094 E 1570 St S
- 1245 E 1520 S
- 1538 S 1170 E
- 1206 E 1480 S
- 1212 E 1570 S
- 1520 S 1170 E