
T
Seller's Agent in 2015
The Harvel Team
Limbird Real Estate Group
(855) 755-7653
86 Total Sales


Estimated Value: $345,000 - $425,648
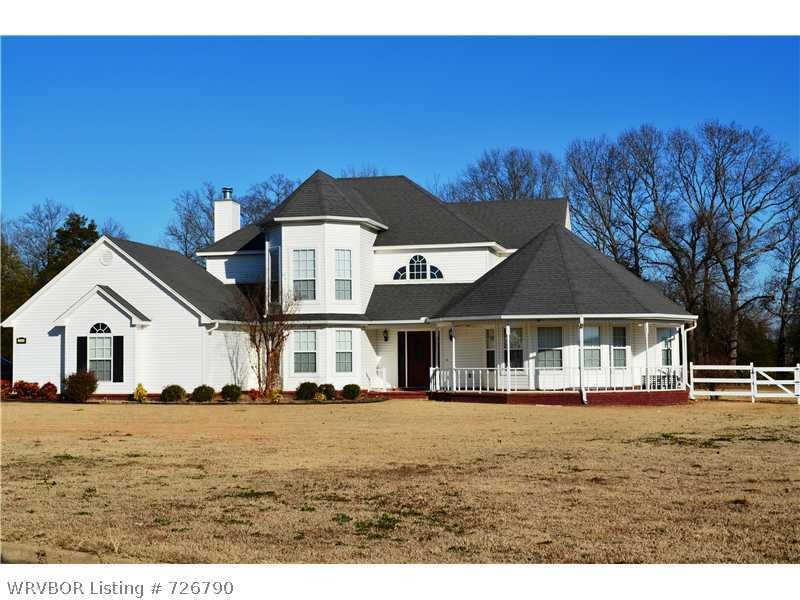
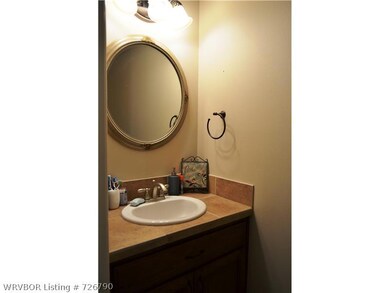
This gorgeous 2704 HSF Architectural Delight sits on 3.85 Acres & has EYE CATCHING CURB APPEAL! Home offers: 2 Living rms, Formal dining rm, Eat-in kitchen w/pantry, 3-4 Bedrooms or an office, 2.5 baths & Master suite with a gas log fireplace! All bed,rooms are spacious. The laundry/mudroom has a sink & lockers. The garage is oversized with a workshop & out back is a nice storage building and a lean to. The lot next door also belongs with this property. Make this your small Ponderosa!
Last Agent to Sell the Property
Limbird Real Estate Group License #SA00054269 Listed on: 02/02/2015
| Date | Buyer | Sale Price | Title Company |
|---|---|---|---|
| Scotty Bonds Family Living Trust | -- | None Listed On Document | |
| Bonds Scotty Alan | -- | None Available | |
| Bonds Scotty A | $220,770 | None Available | |
| Davis Terry A | $229,000 | Crawford Cnty Abstract Co | |
| Axioo-Griffin | $24,000 | -- |
| Date | Status | Borrower | Loan Amount |
|---|---|---|---|
| Previous Owner | Bonds Scotty A | $209,731 | |
| Previous Owner | Davis Terry A | $171,750 |
| Date | Event | Price | List to Sale | Price per Sq Ft |
|---|---|---|---|---|
| 06/30/2015 06/30/15 | Sold | $223,000 | -3.0% | $82 / Sq Ft |
| 05/31/2015 05/31/15 | Pending | -- | -- | -- |
| 02/02/2015 02/02/15 | For Sale | $229,900 | -- | $85 / Sq Ft |
| Year | Tax Paid | Tax Assessment Tax Assessment Total Assessment is a certain percentage of the fair market value that is determined by local assessors to be the total taxable value of land and additions on the property. | Land | Improvement |
|---|---|---|---|---|
| 2025 | $1,932 | $63,610 | $6,000 | $57,610 |
| 2024 | $1,923 | $63,610 | $6,000 | $57,610 |
| 2023 | $1,889 | $63,610 | $6,000 | $57,610 |
| 2022 | $1,829 | $42,230 | $5,400 | $36,830 |
| 2021 | $1,682 | $42,230 | $5,400 | $36,830 |
| 2020 | $1,682 | $42,230 | $5,400 | $36,830 |
| 2019 | $1,951 | $40,060 | $5,400 | $34,660 |
| 2018 | $1,951 | $40,060 | $5,400 | $34,660 |
| 2017 | $1,766 | $37,660 | $5,400 | $32,260 |
| 2016 | $1,766 | $35,210 | $5,400 | $29,810 |
| 2015 | $1,651 | $35,210 | $5,400 | $29,810 |
| 2014 | -- | $32,510 | $2,700 | $29,810 |
T
Seller's Agent in 2015
The Harvel Team
Limbird Real Estate Group
(855) 755-7653
86 Total Sales
L
Seller Co-Listing Agent in 2015
Lindsey Harvel
Limbird Real Estate Group
(479) 719-9400
B
Buyer's Agent in 2015
Barbie Johnson
Keller Williams Platinum Realty
(479) 459-5675
22 Total Sales
Source: Western River Valley Board of REALTORS®
MLS Number: 726790
APN: 760-00623-026
Ask me questions while you tour the home.