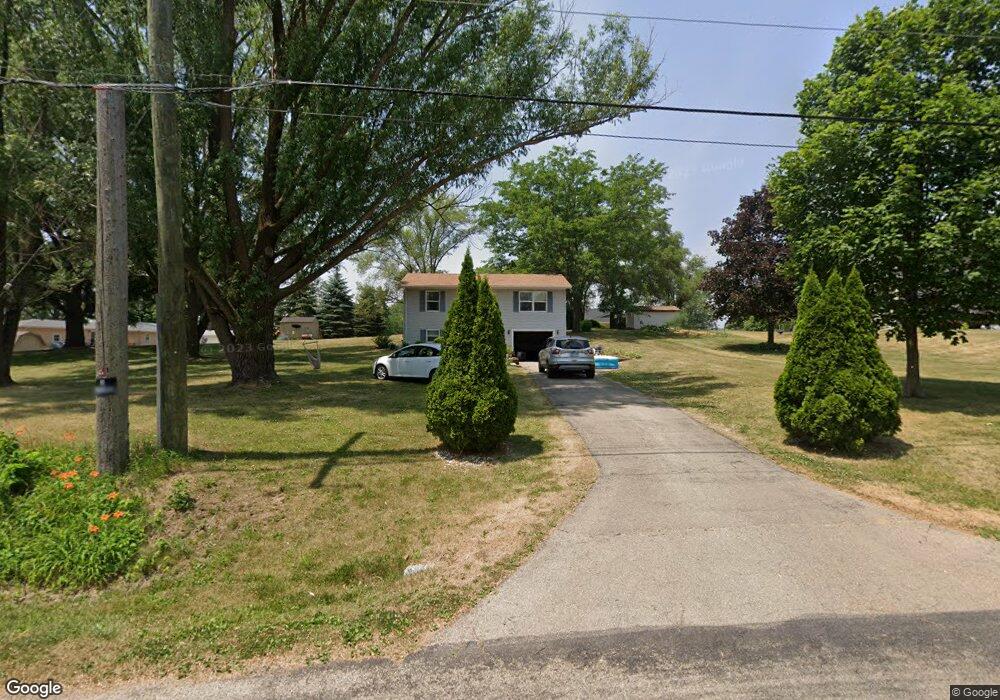
1202 N Illinois St Oregon, IL 61061
Estimated Value: $135,000 - $187,000
3
Beds
2
Baths
1,446
Sq Ft
$115/Sq Ft
Est. Value
About This Home
This home is located at 1202 N Illinois St, Oregon, IL 61061 and is currently estimated at $166,432, approximately $115 per square foot. 1202 N Illinois St is a home located in Ogle County with nearby schools including Oregon Elementary School, David L. Rahn Junior High School, and Oregon High School.
Ownership History
Date
Name
Owned For
Owner Type
Purchase Details
Closed on
Oct 7, 2019
Sold by
Vanmiddendorp Brian J and Vanmiddendorp Mary L
Bought by
Dlmj Investments Llc
Current Estimated Value
Purchase Details
Closed on
Mar 5, 2010
Sold by
The Secretary Of Veterans Affairs
Bought by
Colonial Savings Fa
Home Financials for this Owner
Home Financials are based on the most recent Mortgage that was taken out on this home.
Original Mortgage
$57,720
Interest Rate
5.01%
Mortgage Type
New Conventional
Purchase Details
Closed on
Feb 24, 2010
Sold by
Colonial Savings Fa
Bought by
Vanmiddendorp Brian J and Van Middendorp Mary L
Home Financials for this Owner
Home Financials are based on the most recent Mortgage that was taken out on this home.
Original Mortgage
$57,720
Interest Rate
5.01%
Mortgage Type
New Conventional
Purchase Details
Closed on
Sep 14, 2009
Sold by
Payne Michael J and Payne Kathleen N
Bought by
The Secretary Of Veterans Affairs
Create a Home Valuation Report for This Property
The Home Valuation Report is an in-depth analysis detailing your home's value as well as a comparison with similar homes in the area
Home Values in the Area
Average Home Value in this Area
Purchase History
| Date | Buyer | Sale Price | Title Company |
|---|---|---|---|
| Dlmj Investments Llc | $75,000 | None Available | |
| Colonial Savings Fa | -- | None Available | |
| Vanmiddendorp Brian J | $78,000 | None Available | |
| The Secretary Of Veterans Affairs | $88,130 | None Available |
Source: Public Records
Mortgage History
| Date | Status | Borrower | Loan Amount |
|---|---|---|---|
| Previous Owner | Vanmiddendorp Brian J | $57,720 |
Source: Public Records
Tax History Compared to Growth
Tax History
| Year | Tax Paid | Tax Assessment Tax Assessment Total Assessment is a certain percentage of the fair market value that is determined by local assessors to be the total taxable value of land and additions on the property. | Land | Improvement |
|---|---|---|---|---|
| 2024 | $2,864 | $34,359 | $9,022 | $25,337 |
| 2023 | $2,501 | $31,088 | $8,402 | $22,686 |
| 2022 | $2,348 | $28,775 | $7,777 | $20,998 |
| 2021 | $2,174 | $26,850 | $7,257 | $19,593 |
| 2020 | $2,075 | $25,659 | $6,935 | $18,724 |
| 2019 | $2,802 | $26,680 | $7,211 | $19,469 |
| 2018 | $2,662 | $25,531 | $6,900 | $18,631 |
| 2017 | $2,651 | $25,531 | $6,900 | $18,631 |
| 2016 | $2,536 | $24,636 | $6,658 | $17,978 |
| 2015 | $2,496 | $25,503 | $6,892 | $18,611 |
| 2014 | $2,507 | $25,503 | $6,892 | $18,611 |
| 2013 | $2,491 | $26,772 | $7,235 | $19,537 |
Source: Public Records
Map
Nearby Homes
- 1000 Illinois St
- 990 Illinois St
- 980 Illinois St
- 404 Lillemor Ln
- 104 N 13th St
- 410 Lillemor Ln
- 400 Lillemor Ln
- 405 Lillemor Ln
- 104 S 10th St
- 708 W Washington St
- 908 Madison St
- 400 N 4th St
- 213 N 4th St
- 396 W Margaret Fuller Rd
- 308 S 8th St
- 000 Smith (Lot 31) Dr
- 000 Woods (Lot 26) Dr
- 1011 N Limekiln Rd
- 000 S Anterior Rd
- 503 S 3rd St
- 1202 Illinois St
- 866 N Illinois St
- 1204 Illinois St
- 8 Terrace View Blvd
- 1324 Illinois St Unit 2
- 121 Terrace View Blvd
- 111 Terrace View Blvd
- 1338 Illinois St Unit 2
- 1206 Illinois St
- 99 Terrace View Blvd
- 1203 Illinois St
- 6 Terrace View Blvd
- 416 Williams Dr
- 15 Terrace View Blvd
- Lot 15 Terrace View Blvd
- 26 Terrace View Blvd
- 406 Williams Dr
- 1205 Illinois St
- 436 Williams Dr
- 9 Terrace View Blvd