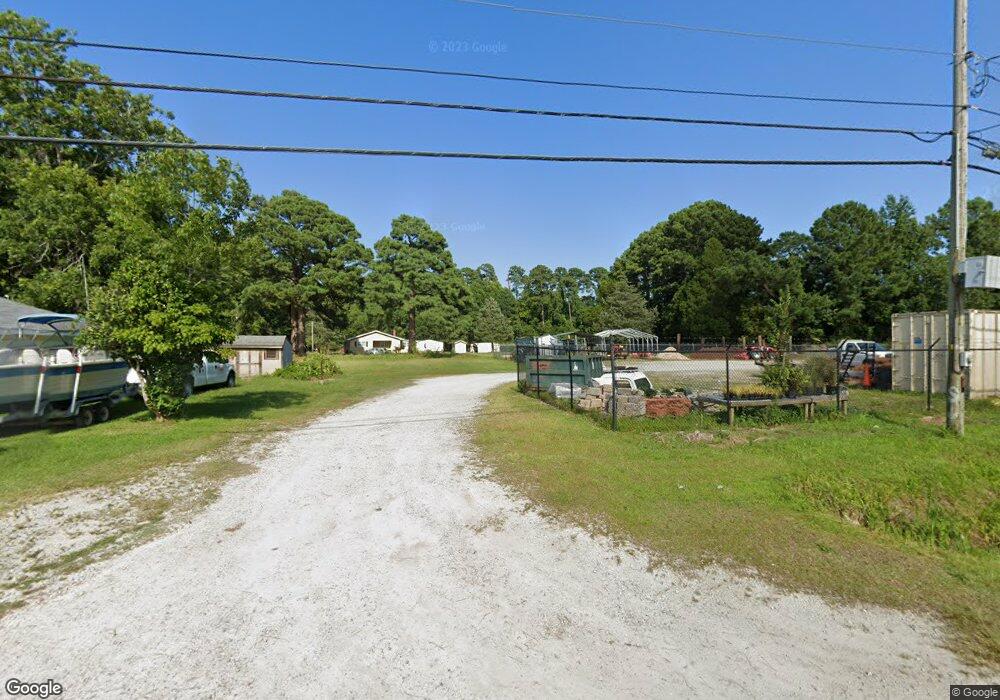
1202 Old Cherry Point Rd New Bern, NC 28560
James City NeighborhoodEstimated Value: $134,653
Studio
--
Bath
44,867
Sq Ft
$3/Sq Ft
Est. Value
About This Home
This home is located at 1202 Old Cherry Point Rd, New Bern, NC 28560 and is currently priced at $134,653, approximately $3 per square foot. 1202 Old Cherry Point Rd is a home located in Craven County with nearby schools including Brinson Memorial Elementary School, Grover C. Fields Middle School, and New Bern High School.
Ownership History
Date
Name
Owned For
Owner Type
Purchase Details
Closed on
Nov 6, 2025
Sold by
Bear Town Rentals Llc
Bought by
Black Bear Group Llc
Current Estimated Value
Home Financials for this Owner
Home Financials are based on the most recent Mortgage that was taken out on this home.
Original Mortgage
$122,500
Outstanding Balance
$122,269
Interest Rate
6.3%
Mortgage Type
New Conventional
Purchase Details
Closed on
Aug 31, 2023
Sold by
Sipe Andrew J and Sipe Christina
Bought by
Bear Town Rentals Llc
Purchase Details
Closed on
Aug 24, 2023
Sold by
Kimble Jack H and Kimble Saranne E
Bought by
Sipe Andrew J
Purchase Details
Closed on
Apr 29, 2019
Sold by
1202 Old Cherry Point Rd
Bought by
Sipe Andrew J and Kimble Saranne E
Purchase Details
Closed on
Mar 15, 2018
Sold by
Sipe Andrew J and Sipe Christina
Bought by
Cherry Point Property Llc
Purchase Details
Closed on
Dec 21, 2017
Sold by
1202 Old Cherry Pt Rd Llc
Bought by
Sipe Andrew J and Kimble Jack H
Purchase Details
Closed on
Jun 7, 2005
Sold by
Winstead William L and Winstead Catherine H
Bought by
Old Cherry Point Road Llc
Purchase Details
Closed on
Apr 11, 2005
Sold by
Winstead William L and Winstead Catherine
Bought by
Winstead Willaim L
Create a Home Valuation Report for This Property
The Home Valuation Report is an in-depth analysis detailing your home's value as well as a comparison with similar homes in the area
Home Values in the Area
Average Home Value in this Area
Purchase History
| Date | Buyer | Sale Price | Title Company |
|---|---|---|---|
| Black Bear Group Llc | $175,000 | None Listed On Document | |
| Bear Town Rentals Llc | -- | None Listed On Document | |
| Sipe Andrew J | -- | None Listed On Document | |
| Kimble Jack H | -- | None Listed On Document | |
| Sipe Andrew J | -- | -- | |
| Cherry Point Property Llc | -- | -- | |
| Sipe Andrew J | -- | -- | |
| Old Cherry Point Road Llc | $68,500 | None Available | |
| Winstead Willaim L | -- | None Available |
Source: Public Records
Mortgage History
| Date | Status | Borrower | Loan Amount |
|---|---|---|---|
| Open | Black Bear Group Llc | $122,500 |
Source: Public Records
Tax History
| Year | Tax Paid | Tax Assessment Tax Assessment Total Assessment is a certain percentage of the fair market value that is determined by local assessors to be the total taxable value of land and additions on the property. | Land | Improvement |
|---|---|---|---|---|
| 2025 | $452 | $97,200 | $91,200 | $6,000 |
| 2024 | $452 | $97,200 | $91,200 | $6,000 |
| 2023 | $452 | $97,200 | $91,200 | $6,000 |
| 2022 | $550 | $94,100 | $85,500 | $8,600 |
| 2021 | $550 | $94,100 | $85,500 | $8,600 |
| 2020 | $541 | $94,100 | $85,500 | $8,600 |
| 2019 | $541 | $94,100 | $85,500 | $8,600 |
| 2018 | $0 | $94,100 | $85,500 | $8,600 |
| 2017 | $533 | $94,100 | $85,500 | $8,600 |
| 2016 | $528 | $132,640 | $121,840 | $10,800 |
| 2015 | $645 | $132,640 | $121,840 | $10,800 |
| 2014 | $644 | $132,640 | $121,840 | $10,800 |
Source: Public Records
Map
Nearby Homes
- 1009 Michael Dr
- 115 Grantham Place
- 142 Grantham Place
- 125 Neeley Ln
- 118 Neeley Ln
- 709 Airport
- 1306 Green Springs Rd
- 409 Plum St
- 2108 Neuse Cliffs Dr
- 410 Brown Dr
- 2122 Neuse Cliffs Cir
- 810 Williams Rd
- 103 Alexis Ct
- 304 Madam Moores Ln
- 402 Swiss Rd
- 109 Clearbrook Way
- 150 Jordan Dr
- 108 Jordan Dr
- 109 Sellhorn Blvd
- 810 Madam Moores Ln
- 1200 Old Cherry Point Rd
- 1203 Old Cherry Point Rd
- 1205 Old Cherry Point Rd
- 1200 U S 70
- 317 Pender St
- 1150 U S 70
- 1208 Old Cherry Point Rd Unit B
- 316 Pender St
- 1150 Us Highway 70 E
- 1108 Old Cherry Point Rd
- 1109 Old Cherry Point Rd
- 1100 U S 70
- 311 Green Springs Rd
- 1212 Old Cherry Point Rd
- 1201 Us 70 Hwy E
- 1205 U S 70 Hwy E
- 309 Green Springs Rd
- 1111 U S 70
- 1207 U S 70 Hwy E
- 1205 Us Highway 70 E
Your Personal Tour Guide
Ask me questions while you tour the home.