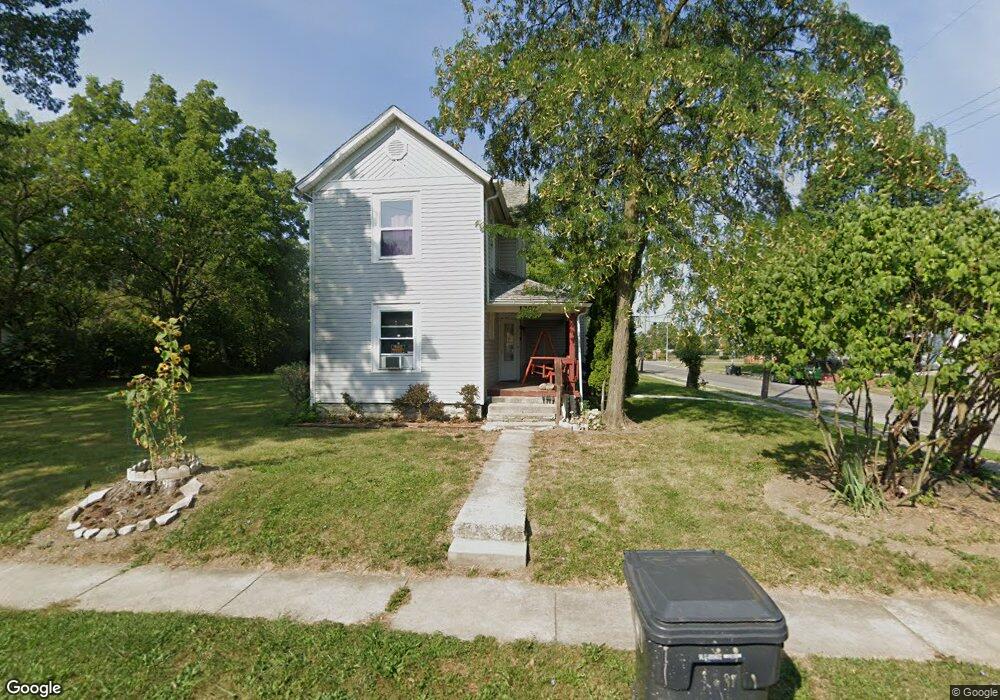
1202 S Union St Lima, OH 45804
Southside Lima NeighborhoodEstimated Value: $60,000 - $91,000
3
Beds
1
Bath
1,208
Sq Ft
$61/Sq Ft
Est. Value
About This Home
This home is located at 1202 S Union St, Lima, OH 45804 and is currently estimated at $74,004, approximately $61 per square foot. 1202 S Union St is a home located in Allen County with nearby schools including Unity Elementary School, Lima North Middle School, and Lima West Middle School.
Ownership History
Date
Name
Owned For
Owner Type
Purchase Details
Closed on
Jun 1, 2017
Sold by
County Of Allen
Bought by
Risser Andrew
Current Estimated Value
Purchase Details
Closed on
Oct 23, 1995
Sold by
White Robert
Bought by
Wright Ruby
Home Financials for this Owner
Home Financials are based on the most recent Mortgage that was taken out on this home.
Original Mortgage
$27,000
Interest Rate
9.25%
Mortgage Type
New Conventional
Purchase Details
Closed on
Mar 30, 1992
Bought by
White Robert J
Create a Home Valuation Report for This Property
The Home Valuation Report is an in-depth analysis detailing your home's value as well as a comparison with similar homes in the area
Home Values in the Area
Average Home Value in this Area
Purchase History
| Date | Buyer | Sale Price | Title Company |
|---|---|---|---|
| Risser Andrew | $13,735 | None Available | |
| Wright Ruby | $27,000 | -- | |
| White Robert J | $8,000 | -- |
Source: Public Records
Mortgage History
| Date | Status | Borrower | Loan Amount |
|---|---|---|---|
| Previous Owner | Wright Ruby | $27,000 |
Source: Public Records
Tax History
| Year | Tax Paid | Tax Assessment Tax Assessment Total Assessment is a certain percentage of the fair market value that is determined by local assessors to be the total taxable value of land and additions on the property. | Land | Improvement |
|---|---|---|---|---|
| 2024 | $569 | $14,320 | $2,910 | $11,410 |
| 2023 | $663 | $13,620 | $2,770 | $10,850 |
| 2022 | $614 | $13,620 | $2,770 | $10,850 |
| 2021 | $701 | $13,620 | $2,770 | $10,850 |
| 2020 | $721 | $13,550 | $2,350 | $11,200 |
| 2019 | $721 | $13,550 | $2,350 | $11,200 |
| 2018 | $714 | $13,550 | $2,350 | $11,200 |
| 2017 | $398 | $13,550 | $2,350 | $11,200 |
| 2016 | $2,186 | $13,550 | $2,350 | $11,200 |
| 2015 | $1,439 | $13,550 | $2,350 | $11,200 |
| 2014 | $1,439 | $15,480 | $2,420 | $13,060 |
| 2013 | $1,804 | $15,480 | $2,420 | $13,060 |
Source: Public Records
Map
Nearby Homes
Your Personal Tour Guide
Ask me questions while you tour the home.