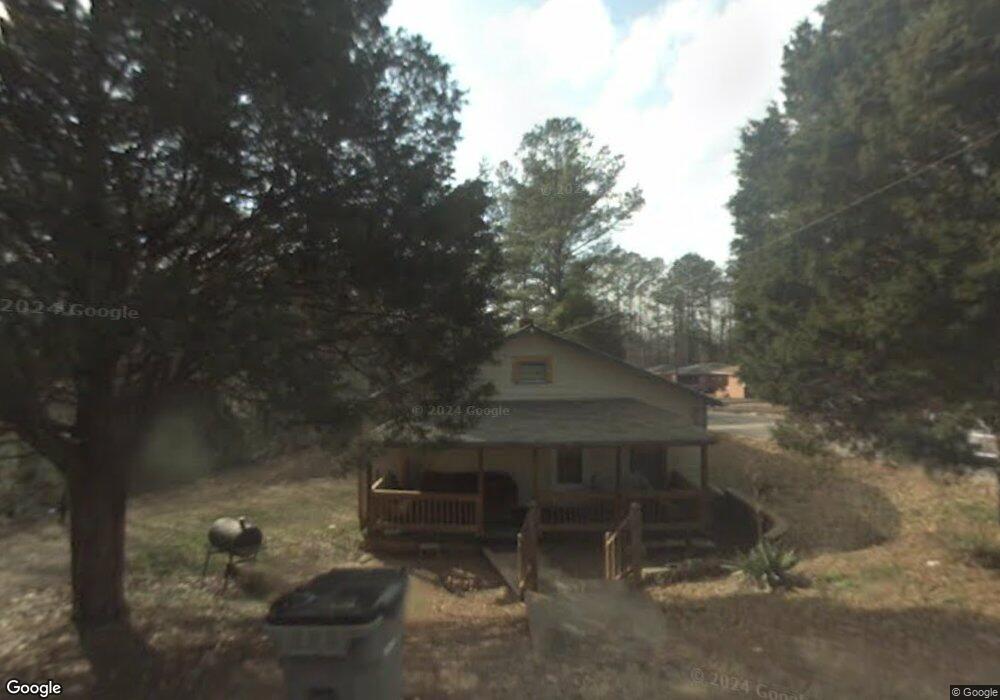
1202 Simmons St Lagrange, GA 30241
Estimated Value: $59,000 - $86,000
2
Beds
1
Bath
873
Sq Ft
$87/Sq Ft
Est. Value
About This Home
This home is located at 1202 Simmons St, Lagrange, GA 30241 and is currently estimated at $76,302, approximately $87 per square foot. 1202 Simmons St is a home located in Troup County with nearby schools including Whitesville Road Elementary School, Berta Weathersbee Elementary School, and Rosemont Elementary School.
Ownership History
Date
Name
Owned For
Owner Type
Purchase Details
Closed on
Apr 15, 2024
Sold by
Thurman Bianca
Bought by
Ramirez Lucas Omar
Current Estimated Value
Purchase Details
Closed on
Apr 27, 2022
Sold by
Hall Doris Thurman
Bought by
Thurman Bianca and Mcbride Ebony
Purchase Details
Closed on
Apr 6, 2005
Sold by
Grady Riley
Bought by
Hall Doris Thurman
Home Financials for this Owner
Home Financials are based on the most recent Mortgage that was taken out on this home.
Original Mortgage
$8,711
Interest Rate
5.98%
Mortgage Type
New Conventional
Purchase Details
Closed on
Mar 26, 2001
Sold by
Linda Bobby and Linda Yarbrough
Bought by
Grady Riley
Purchase Details
Closed on
Feb 1, 2001
Sold by
Mattie Riley
Bought by
Linda Bobby and Linda Yarbrough
Purchase Details
Closed on
Mar 3, 1998
Sold by
Riley Mattie
Bought by
Mattie Riley
Purchase Details
Closed on
Oct 1, 1983
Sold by
Carry Beula and Carry Swindle
Bought by
Riley Mattie
Create a Home Valuation Report for This Property
The Home Valuation Report is an in-depth analysis detailing your home's value as well as a comparison with similar homes in the area
Purchase History
| Date | Buyer | Sale Price | Title Company |
|---|---|---|---|
| Ramirez Lucas Omar | $24,000 | -- | |
| Thurman Bianca | -- | -- | |
| Hall Doris Thurman | $8,000 | -- | |
| Grady Riley | -- | -- | |
| Linda Bobby | -- | -- | |
| Mattie Riley | $1,000 | -- | |
| Riley Mattie | -- | -- |
Source: Public Records
Mortgage History
| Date | Status | Borrower | Loan Amount |
|---|---|---|---|
| Previous Owner | Hall Doris Thurman | $8,711 |
Source: Public Records
Tax History
| Year | Tax Paid | Tax Assessment Tax Assessment Total Assessment is a certain percentage of the fair market value that is determined by local assessors to be the total taxable value of land and additions on the property. | Land | Improvement |
|---|---|---|---|---|
| 2025 | $571 | $20,920 | $3,880 | $17,040 |
| 2024 | $527 | $19,320 | $3,880 | $15,440 |
| 2023 | $456 | $16,720 | $3,880 | $12,840 |
| 2022 | $443 | $15,880 | $3,880 | $12,000 |
| 2021 | $361 | $11,960 | $1,280 | $10,680 |
| 2020 | $361 | $11,960 | $1,280 | $10,680 |
| 2019 | $337 | $11,180 | $1,300 | $9,880 |
| 2018 | $337 | $11,180 | $1,300 | $9,880 |
| 2017 | $337 | $11,180 | $1,300 | $9,880 |
| 2016 | $333 | $11,047 | $1,300 | $9,747 |
| 2015 | $334 | $11,047 | $1,300 | $9,747 |
| 2014 | $327 | $10,821 | $1,300 | $9,521 |
| 2013 | -- | $11,591 | $1,300 | $10,291 |
Source: Public Records
Map
Nearby Homes
- 304 Butler St
- 0 Boggs St Unit 10550243
- 0 Boggs St Unit 10550231
- 0 Boggs St Unit 10550239
- 0 Boggs St Unit 10550250
- 0 Bagley St
- 112 Cedar St
- 109 Bell St
- 1404-1406 Hamilton
- 1404 Hamilton Rd
- 103 Cedar St
- 901 Whiteline St
- 1191 Whitesville St
- 1201 Whitesville St
- 0 E Fendig St
- 113 E Fendig St
- 130 Edgewood Ave
- LOT 33 E Hillside Dr
- LOT 34 E Hillside Dr
- 501 Milam St
- 311 Butler St
- 309 Butler St
- 1108 Simmons St
- 406 Butler St
- 307 Butler St
- 403 Butler St
- 1101 Boggs St
- 1109 Simmons St
- 305 Butler St
- 408 Butler St
- 1106 Simmons St
- 405 Butler St
- 303 Butler St
- 1107 Simmons St
- 14051407 Hamilton Rd
- 5989 Hamilton Rd
- 1105 Simmons St
- 1200 Hamilton Dr
- 1200 Hamilton Rd
- 1102 Simmons St
Your Personal Tour Guide
Ask me questions while you tour the home.