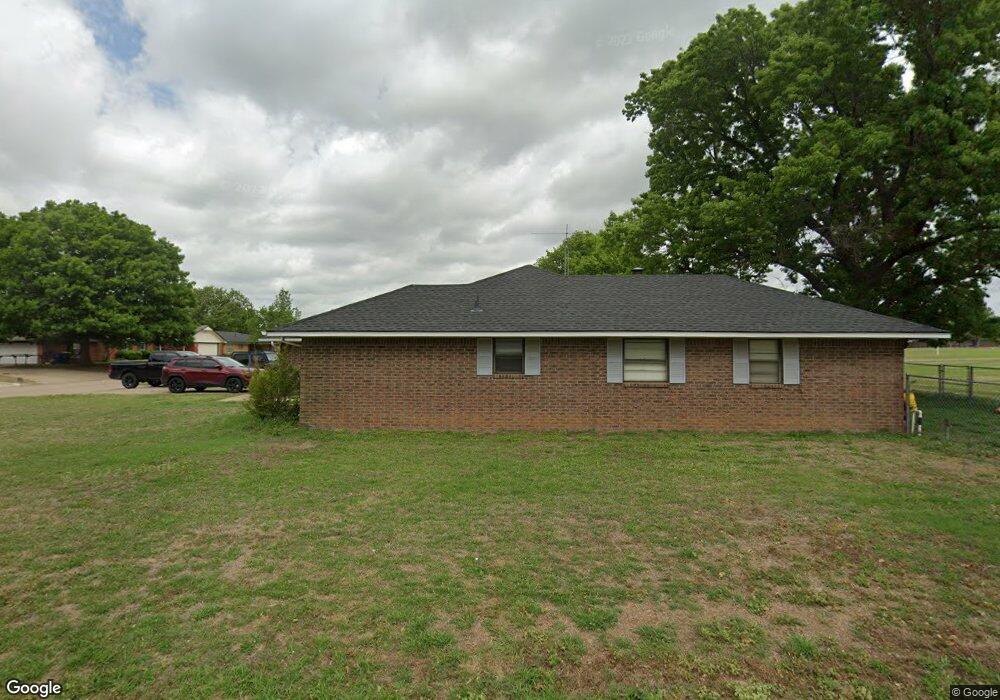
1202 W Randall Ct Duncan, OK 73533
Estimated Value: $221,112 - $286,000
4
Beds
3
Baths
2,419
Sq Ft
$100/Sq Ft
Est. Value
About This Home
This home is located at 1202 W Randall Ct, Duncan, OK 73533 and is currently estimated at $242,028, approximately $100 per square foot. 1202 W Randall Ct is a home located in Stephens County with nearby schools including Horace Mann Elementary School, Duncan Middle School, and Duncan High School.
Ownership History
Date
Name
Owned For
Owner Type
Purchase Details
Closed on
Jul 12, 2013
Sold by
Kimbrough Stephen F and Kimbrough Faye I
Bought by
Brower Linda C
Current Estimated Value
Purchase Details
Closed on
Aug 2, 2010
Sold by
Hervey Karol Ann and Hervey John D
Bought by
Kimbrough Stephen F and Kimbrough Faye I
Home Financials for this Owner
Home Financials are based on the most recent Mortgage that was taken out on this home.
Original Mortgage
$35,000
Interest Rate
4.76%
Mortgage Type
New Conventional
Purchase Details
Closed on
Jul 13, 2004
Sold by
Howard Jo L
Purchase Details
Closed on
Nov 3, 1999
Sold by
Ragland Stephen W and Ragland Ayna
Purchase Details
Closed on
Jun 29, 1995
Sold by
For Hamilton For Hamilton F and For Hamilton F
Purchase Details
Closed on
Jan 22, 1994
Sold by
Blalcok Sammy E
Create a Home Valuation Report for This Property
The Home Valuation Report is an in-depth analysis detailing your home's value as well as a comparison with similar homes in the area
Purchase History
| Date | Buyer | Sale Price | Title Company |
|---|---|---|---|
| Brower Linda C | $172,500 | None Available | |
| Kimbrough Stephen F | $76,500 | Stewart Abstract & Title Of | |
| Kimbrough Stephen F | $76,500 | Stewart Abstract & Title Of | |
| -- | -- | -- | |
| -- | $110,000 | -- | |
| -- | $105,000 | -- | |
| -- | $110,000 | -- |
Source: Public Records
Mortgage History
| Date | Status | Borrower | Loan Amount |
|---|---|---|---|
| Previous Owner | Kimbrough Stephen F | $35,000 |
Source: Public Records
Tax History
| Year | Tax Paid | Tax Assessment Tax Assessment Total Assessment is a certain percentage of the fair market value that is determined by local assessors to be the total taxable value of land and additions on the property. | Land | Improvement |
|---|---|---|---|---|
| 2025 | $1,807 | $21,418 | $1,287 | $20,131 |
| 2024 | $1,655 | $19,427 | $1,287 | $18,140 |
| 2023 | $1,655 | $19,427 | $1,287 | $18,140 |
| 2022 | $1,498 | $18,502 | $1,287 | $17,215 |
| 2021 | $1,429 | $16,782 | $1,287 | $15,495 |
| 2020 | $1,486 | $17,208 | $1,287 | $15,921 |
| 2019 | $1,441 | $16,656 | $1,287 | $15,369 |
| 2018 | $1,527 | $17,144 | $1,287 | $15,857 |
| 2017 | $1,494 | $17,385 | $1,287 | $16,098 |
| 2016 | $1,581 | $18,596 | $1,287 | $17,309 |
| 2015 | $1,060 | $19,080 | $1,287 | $17,793 |
| 2014 | $1,060 | $19,080 | $1,287 | $17,793 |
Source: Public Records
Map
Nearby Homes
- 903 N Harville Rd
- 2206 W Spruce Ave
- 1309 Whisenant Ct
- NO ADDRESS W Elk Ave
- 1311 Whisenant Ct
- 2202 Canary Ave
- 1928 W Parkview Ave
- 2202 Flamingo Ln
- 1212 N 20th St
- 2210 Western Dr
- 2120 Flamingo Ln
- 2610 Virginia St
- 1817 W Parkview Ave
- 1902 W Randall Ave
- 2002 Redbud Ave
- 1099 N 19th St
- 2407 W Mallard Dr
- 2201 Mallard
- 2310 Rockwell Dr
- 3425 Kacey St
- 1204 W Randall Ct
- 1204 1204 Randall Ct
- 1201 N Harville Rd
- 1203 N Harville Rd
- 2407 W Randall Ave
- 2302 W Randall Ave
- 1206 W Randall Ct
- 2404 W Randall Ave
- 1205 N Harville Rd
- 1107 N Harville Rd
- 1205 1205 Harville
- 1212 W Randall Ct
- 2406 W Randall Ave
- 1207 N Harville Rd
- 1105 N Harville Rd
- 1208 W Randall Ct
- 1208 W Randall Ct
- 2409 W Randall Ave
- 1116 N Primrose Ct
- 1210 W Randall Ct
Your Personal Tour Guide
Ask me questions while you tour the home.