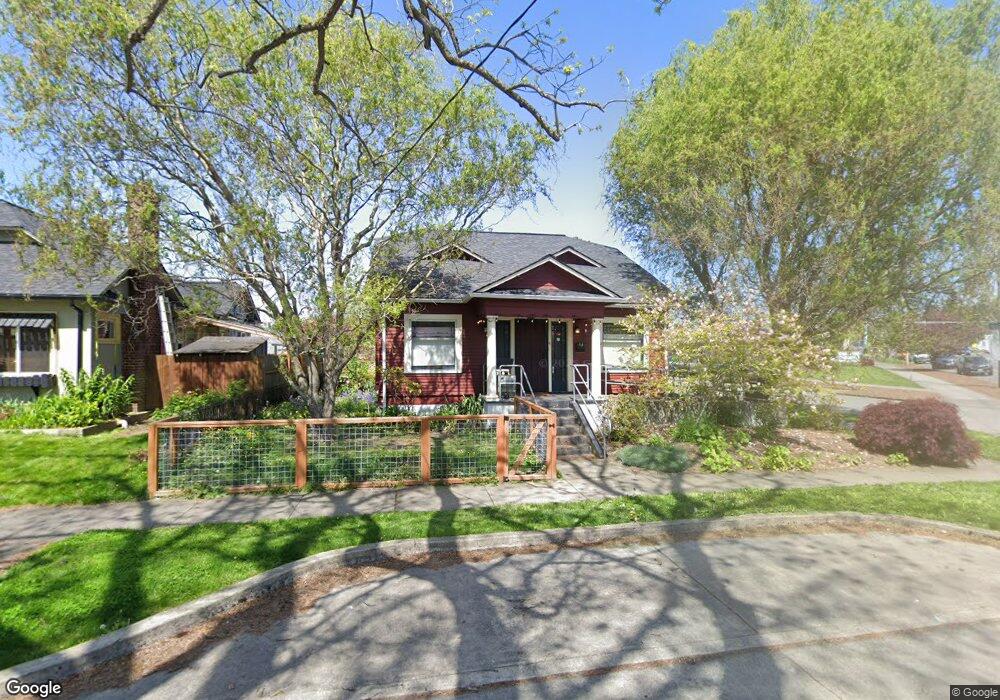
1202 Washington St Bellingham, WA 98225
Columbia NeighborhoodEstimated Value: $693,000 - $736,000
2
Beds
1
Bath
1,193
Sq Ft
$597/Sq Ft
Est. Value
About This Home
This home is located at 1202 Washington St, Bellingham, WA 98225 and is currently estimated at $712,068, approximately $596 per square foot. 1202 Washington St is a home located in Whatcom County with nearby schools including Columbia Elementary School, Whatcom Middle School, and Bellingham High School.
Ownership History
Date
Name
Owned For
Owner Type
Purchase Details
Closed on
Apr 27, 2007
Sold by
Wells J Carole and Wells June Carole
Bought by
Arvin Diane M
Current Estimated Value
Home Financials for this Owner
Home Financials are based on the most recent Mortgage that was taken out on this home.
Original Mortgage
$47,100
Outstanding Balance
$28,556
Interest Rate
6.11%
Mortgage Type
Stand Alone Second
Estimated Equity
$683,512
Purchase Details
Closed on
Feb 27, 2007
Sold by
Wells Skyla
Bought by
Wells June Carole
Home Financials for this Owner
Home Financials are based on the most recent Mortgage that was taken out on this home.
Original Mortgage
$235,500
Outstanding Balance
$142,778
Interest Rate
6.11%
Mortgage Type
Purchase Money Mortgage
Estimated Equity
$569,290
Purchase Details
Closed on
Feb 20, 2003
Sold by
Wells J Carole
Bought by
Wells J Carole and Wells Skyla
Home Financials for this Owner
Home Financials are based on the most recent Mortgage that was taken out on this home.
Original Mortgage
$112,000
Interest Rate
7.37%
Create a Home Valuation Report for This Property
The Home Valuation Report is an in-depth analysis detailing your home's value as well as a comparison with similar homes in the area
Home Values in the Area
Average Home Value in this Area
Purchase History
| Date | Buyer | Sale Price | Title Company |
|---|---|---|---|
| Arvin Diane M | $314,280 | Whatcom Land Title | |
| Wells June Carole | -- | None Available | |
| Wells J Carole | $50,869 | Chicago Title Insurance |
Source: Public Records
Mortgage History
| Date | Status | Borrower | Loan Amount |
|---|---|---|---|
| Open | Arvin Diane M | $47,100 | |
| Open | Arvin Diane M | $235,500 | |
| Previous Owner | Wells J Carole | $112,000 |
Source: Public Records
Tax History Compared to Growth
Tax History
| Year | Tax Paid | Tax Assessment Tax Assessment Total Assessment is a certain percentage of the fair market value that is determined by local assessors to be the total taxable value of land and additions on the property. | Land | Improvement |
|---|---|---|---|---|
| 2024 | $4,843 | $606,772 | $270,928 | $335,844 |
| 2023 | $4,843 | $622,216 | $277,824 | $344,392 |
| 2022 | $3,595 | $536,395 | $239,504 | $296,891 |
| 2021 | $3,527 | $387,004 | $172,800 | $214,204 |
| 2020 | $3,588 | $358,337 | $160,000 | $198,337 |
| 2019 | $3,212 | $352,328 | $124,778 | $227,550 |
| 2018 | $3,234 | $316,261 | $112,028 | $204,233 |
| 2017 | $2,790 | $272,290 | $96,450 | $175,840 |
| 2016 | $2,441 | $245,520 | $86,550 | $158,970 |
| 2015 | $2,394 | $223,618 | $79,050 | $144,568 |
| 2014 | -- | $212,161 | $75,000 | $137,161 |
| 2013 | -- | $212,087 | $73,500 | $138,587 |
Source: Public Records
Map
Nearby Homes
- 1800 J St
- 2500 Meridian St
- 1410 J St
- 1315 Astor St
- 2600 Elm St
- 1200 W Holly St
- 2805 Walnut St
- 2218 Jaeger St
- 2500 Cornwall Ave
- 2019 Cornwall Ave
- 3008 Meridian St
- 3018 Elm St
- 1025 Granary Ave Unit 503
- 1025 Granary Ave Unit 404
- 1025 Granary Ave Unit 306
- 1025 Granary Ave Unit 506
- 1025 Granary Ave Unit 501-A
- 1025 Granary Ave Unit 307-B
- 1025 Granary Ave Unit 408
- 1025 Granary Ave Unit 407