Estimated Value: $373,635 - $433,000
4
Beds
3
Baths
2,569
Sq Ft
$159/Sq Ft
Est. Value
About This Home
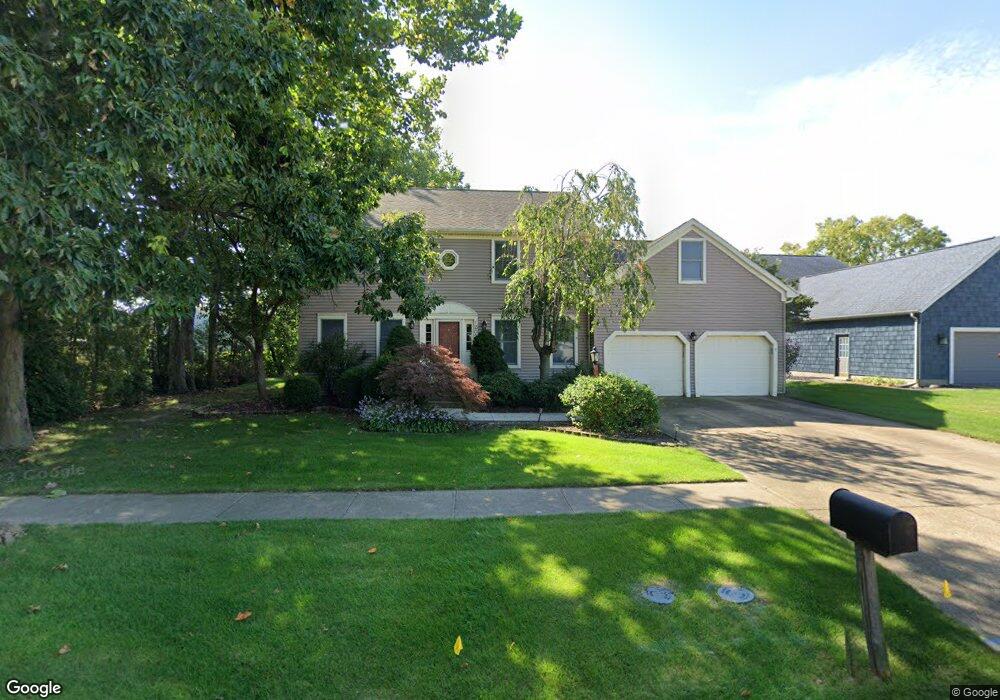
This home is located at 1202 Wickford Place, Huron, OH 44839 and is currently estimated at $407,659, approximately $158 per square foot. 1202 Wickford Place is a home located in Erie County with nearby schools including Woodlands Intermediate School, Shawnee Elementary School, and McCormick Junior High School.
Ownership History
Date
Name
Owned For
Owner Type
Purchase Details
Closed on
Apr 24, 2006
Sold by
Odell Hannah L
Bought by
Odell Andrew G
Current Estimated Value
Purchase Details
Closed on
May 10, 2002
Sold by
Trumpler Steven F
Bought by
O'Dell Andrew G and O'Dell Hannah L
Purchase Details
Closed on
May 14, 1999
Sold by
Myers Tony J
Bought by
Trumpler Steven F
Purchase Details
Closed on
Jan 12, 1998
Sold by
Hafner Robert
Bought by
Myers Tony J Cathleen
Home Financials for this Owner
Home Financials are based on the most recent Mortgage that was taken out on this home.
Original Mortgage
$123,000
Interest Rate
7.26%
Mortgage Type
New Conventional
Create a Home Valuation Report for This Property
The Home Valuation Report is an in-depth analysis detailing your home's value as well as a comparison with similar homes in the area
Home Values in the Area
Average Home Value in this Area
Purchase History
| Date | Buyer | Sale Price | Title Company |
|---|---|---|---|
| Odell Andrew G | -- | None Available | |
| O'Dell Andrew G | $210,000 | -- | |
| Trumpler Steven F | $206,500 | -- | |
| Myers Tony J Cathleen | $173,000 | -- |
Source: Public Records
Mortgage History
| Date | Status | Borrower | Loan Amount |
|---|---|---|---|
| Previous Owner | Myers Tony J Cathleen | $123,000 | |
| Closed | Trumpler Steven F | -- |
Source: Public Records
Tax History
| Year | Tax Paid | Tax Assessment Tax Assessment Total Assessment is a certain percentage of the fair market value that is determined by local assessors to be the total taxable value of land and additions on the property. | Land | Improvement |
|---|---|---|---|---|
| 2024 | $4,118 | $106,333 | $18,490 | $87,843 |
| 2023 | $4,229 | $74,997 | $16,362 | $58,635 |
| 2022 | $3,109 | $75,004 | $16,362 | $58,642 |
| 2021 | $3,100 | $75,000 | $16,360 | $58,640 |
| 2020 | $3,132 | $73,820 | $16,360 | $57,460 |
| 2019 | $3,270 | $73,820 | $16,360 | $57,460 |
| 2018 | $3,288 | $73,820 | $16,360 | $57,460 |
| 2017 | $2,952 | $64,430 | $16,040 | $48,390 |
| 2016 | $2,858 | $64,430 | $16,040 | $48,390 |
| 2015 | $2,855 | $64,430 | $16,040 | $48,390 |
| 2014 | $2,736 | $61,040 | $16,040 | $45,000 |
| 2013 | $2,697 | $61,040 | $16,040 | $45,000 |
Source: Public Records
Map
Nearby Homes
- 1208 Cleveland Rd W
- 1 Cleveland Rd W
- 1361 Cleveland Rd W Unit C
- 721 Creekside Dr
- 706 Creekside Dr
- 0 Bucyrus Ave
- 11 Turtle Bay
- 201 Dayton Ave
- 919 Glenview Dr
- 2016 Cleveland Rd W
- 0 W Cleveland Rd
- 224 Atwood Place
- 220 Overlook Rd
- 41 Richland Ave
- 28 Turtle Bay
- 2008 Shore Dr
- 122 Atwood Place
- 0 Bogart Rd
- 676 Salem Dr
- 0 Main St
- 1204 Wickford Place
- 321 Wexford Dr
- 319 Wexford Dr
- 327 Chatham Place
- 323 Wexford Dr
- 317 Wexford Dr
- 325 Wexford Dr
- 1203 Wickford Place
- 1208 Wickford Place
- 329 Chatham Place
- 1205 Wickford Place
- 315 Wexford Dr
- 326 Canterbury Dr
- 320 Wexford Dr
- 331 Chatham Place
- 322 Wexford Dr
- 1210 Wickford Place
- 318 Wexford Dr
- 41 Wickford Place
- 30 Wickford Place
Your Personal Tour Guide
Ask me questions while you tour the home.