12020 Roth Rd Grabill, IN 46741
Estimated Value: $397,000 - $1,202,000
3
Beds
3
Baths
2,766
Sq Ft
$284/Sq Ft
Est. Value
About This Home
This home is located at 12020 Roth Rd, Grabill, IN 46741 and is currently estimated at $786,852, approximately $284 per square foot. 12020 Roth Rd is a home located in Allen County with nearby schools including Woodlan Junior/Senior High School, Maple Lane School, and Gateway Woods School.
Ownership History
Date
Name
Owned For
Owner Type
Purchase Details
Closed on
Jul 18, 2025
Sold by
Schmucker Martin
Bought by
Schmucker Martin J
Current Estimated Value
Purchase Details
Closed on
May 29, 2009
Sold by
Howell G Douglas
Bought by
Schmucker Martin
Purchase Details
Closed on
Aug 19, 2008
Sold by
Graber Benjamin E and Graber Amy Kay
Bought by
Graber Alvin A and Graber Irene K
Purchase Details
Closed on
Aug 3, 2007
Sold by
Graber Alvin A and Graber Irene K
Bought by
Brandenberger Willis B and Brandenberger Barbara
Purchase Details
Closed on
Jul 18, 2007
Sold by
Graber Benjamin E and Graber Amy Kay
Bought by
Graber Alvin A and Graber Irene K
Purchase Details
Closed on
Jan 27, 2006
Sold by
Graber Benjamin E and Graber Amy Kay
Bought by
Schmucker Mervin J and Schmucker Keturah
Purchase Details
Closed on
Jan 17, 2006
Sold by
Graber Benjamin E and Graber Amy Kay
Bought by
Schmucker Mervin J and Schmucker Keturah
Create a Home Valuation Report for This Property
The Home Valuation Report is an in-depth analysis detailing your home's value as well as a comparison with similar homes in the area
Home Values in the Area
Average Home Value in this Area
Purchase History
| Date | Buyer | Sale Price | Title Company |
|---|---|---|---|
| Schmucker Martin J | $517,000 | None Listed On Document | |
| Schmucker Martin | -- | Lawyers Title | |
| Howell G Douglas | -- | Lawyers Title | |
| Graber Benjamin E | -- | Lawyers Title | |
| Graber Alvin A | -- | None Available | |
| Brandenberger Willis B | -- | Lawyers Title | |
| Graber Alvin A | -- | Lawyers Title | |
| Brandenberger Willis | -- | Lawyers Title | |
| Graber Alvin A | -- | Lawyers Title | |
| Schmucker Mervin J | -- | None Available | |
| Schmucker Mervin J | -- | None Available |
Source: Public Records
Tax History Compared to Growth
Tax History
| Year | Tax Paid | Tax Assessment Tax Assessment Total Assessment is a certain percentage of the fair market value that is determined by local assessors to be the total taxable value of land and additions on the property. | Land | Improvement |
|---|---|---|---|---|
| 2024 | $5,171 | $637,200 | $112,200 | $525,000 |
| 2022 | $4,318 | $469,200 | $86,700 | $382,500 |
| 2021 | $3,989 | $414,200 | $79,800 | $334,400 |
| 2020 | $4,271 | $403,700 | $79,500 | $324,200 |
| 2019 | $3,835 | $393,600 | $88,600 | $305,000 |
| 2018 | $3,343 | $344,200 | $89,600 | $254,600 |
| 2017 | $3,498 | $339,100 | $97,300 | $241,800 |
| 2016 | $3,405 | $321,400 | $100,900 | $220,500 |
| 2014 | $3,685 | $341,300 | $103,800 | $237,500 |
| 2013 | $3,389 | $317,200 | $94,400 | $222,800 |
Source: Public Records
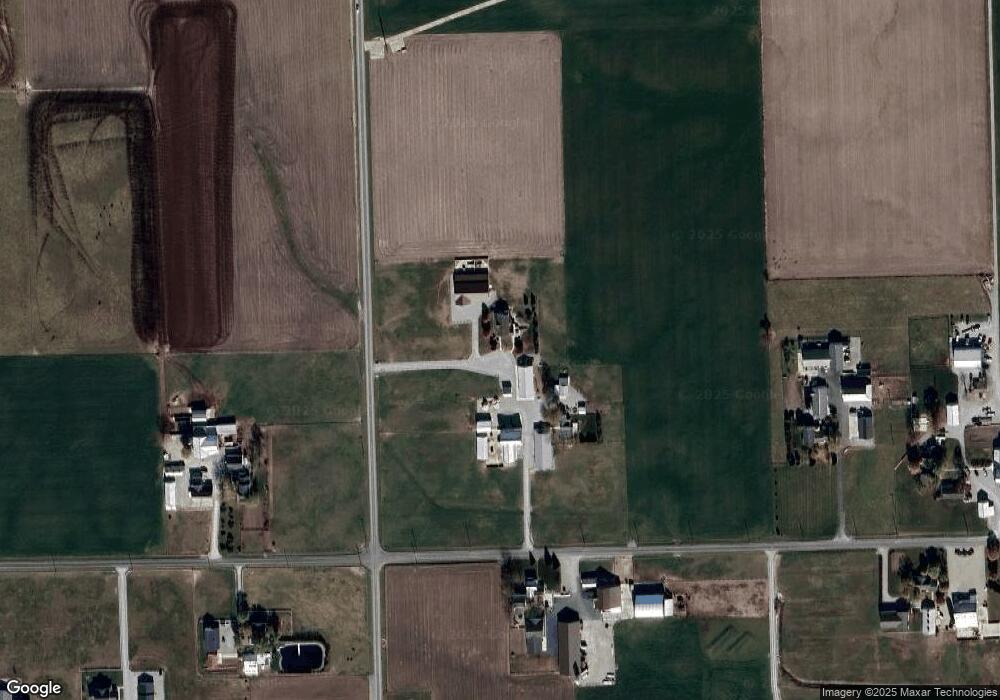
Map
Nearby Homes
- 13537 West St
- 13542 Fairview Dr
- 13618 Walker Mill Ct
- TBD Sunset Pass
- 11328 Garden Way
- 17315 Antwerp Rd
- 0 Sunset Pass Lot B Pass
- 16729 Darling Rd
- 11934 Grabill Rd
- 15720 Roth Rd
- 11717 Markham Ct
- 11731 Butternut Cove
- 15329 Makarios Pass Unit 29
- 10964 Conrad Creek Ct Unit 14
- 13638 Leo Rd
- 13234 Leo Rd
- 10802 Conrad Creek Ct Unit 23
- 15471 Makarios Pass Unit 35
- 10878 Conrad Creek Ct Unit 17
- 15386 Makarios Pass Unit 8
- 14425 Antwerp Rd
- 14408 Antwerp Rd
- 14633 Antwerp Rd
- 14133 Antwerp Rd
- 14134 Antwerp Rd
- 14100 Antwerp Rd
- 14723 Antwerp Rd
- 14726 Antwerp Rd
- 14032 Antwerp Rd
- 14812 Antwerp Rd
- 13914 Antwerp Rd
- 11415 Roth Rd
- 12618 Roth Rd
- 13804 Antwerp Rd
- 11310 Roth Rd
- 13817 Antwerp Rd
- 14914 Grabill Rd
- 13790 Antwerp Rd
- 15125 Antwerp Rd
- 12811 Roth Rd