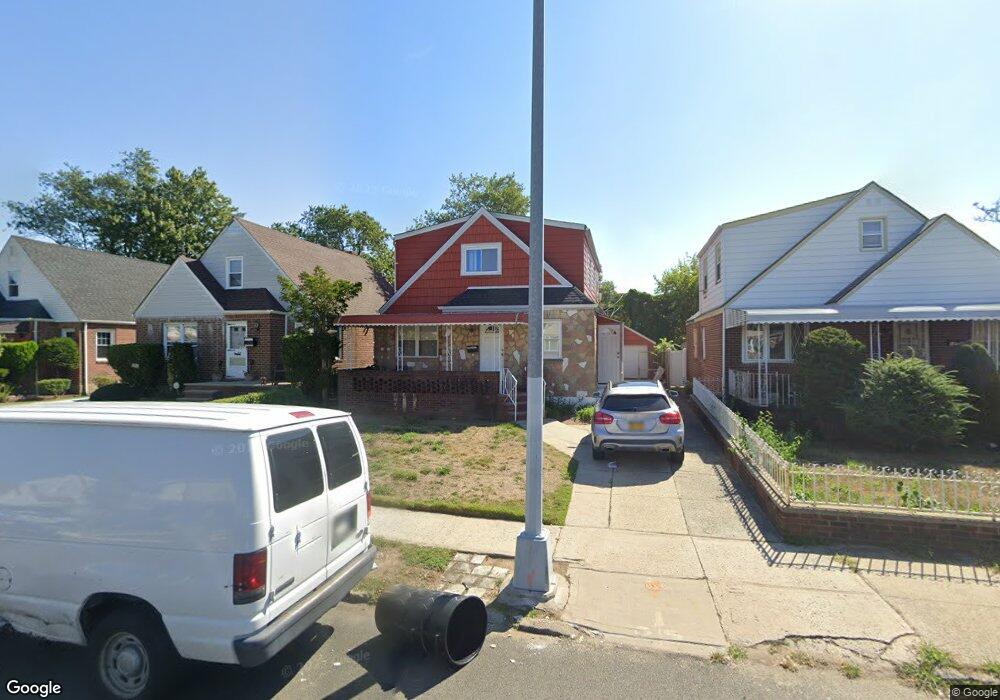
12027 232nd St Cambria Heights, NY 11411
Cambria Heights NeighborhoodEstimated Value: $728,000 - $960,000
--
Bed
--
Bath
2,042
Sq Ft
$399/Sq Ft
Est. Value
About This Home
This home is located at 12027 232nd St, Cambria Heights, NY 11411 and is currently estimated at $815,031, approximately $399 per square foot. 12027 232nd St is a home located in Queens County with nearby schools including P.S. 176 Cambria Heights, Is 59 Springfield Gardens, and Cambria Center For The Gifted Child.
Ownership History
Date
Name
Owned For
Owner Type
Purchase Details
Closed on
Dec 3, 2021
Sold by
A and K
Bought by
Sainvil Cynthia and Sainvil Henry
Current Estimated Value
Home Financials for this Owner
Home Financials are based on the most recent Mortgage that was taken out on this home.
Original Mortgage
$355,000
Outstanding Balance
$326,419
Interest Rate
3.09%
Mortgage Type
Purchase Money Mortgage
Estimated Equity
$488,612
Purchase Details
Closed on
Oct 1, 2003
Sold by
Mackey Jr Esq As Referee, William F
Bought by
Seeram Ravi
Purchase Details
Closed on
Mar 18, 1997
Sold by
Reaves George D and Reaves Earnestine
Bought by
Stanley Ilean and Stanley Charles
Home Financials for this Owner
Home Financials are based on the most recent Mortgage that was taken out on this home.
Original Mortgage
$152,352
Interest Rate
7.76%
Mortgage Type
FHA
Create a Home Valuation Report for This Property
The Home Valuation Report is an in-depth analysis detailing your home's value as well as a comparison with similar homes in the area
Home Values in the Area
Average Home Value in this Area
Purchase History
| Date | Buyer | Sale Price | Title Company |
|---|---|---|---|
| Sainvil Cynthia | $450,000 | -- | |
| Seeram Ravi | $280,000 | -- | |
| Stanley Ilean | $163,000 | Stewart Title Insurance Co |
Source: Public Records
Mortgage History
| Date | Status | Borrower | Loan Amount |
|---|---|---|---|
| Open | Sainvil Cynthia | $355,000 | |
| Previous Owner | Stanley Ilean | $152,352 |
Source: Public Records
Tax History Compared to Growth
Tax History
| Year | Tax Paid | Tax Assessment Tax Assessment Total Assessment is a certain percentage of the fair market value that is determined by local assessors to be the total taxable value of land and additions on the property. | Land | Improvement |
|---|---|---|---|---|
| 2025 | $7,008 | $36,985 | $10,797 | $26,188 |
| 2024 | $7,008 | $34,892 | $11,533 | $23,359 |
| 2023 | $6,612 | $32,918 | $9,646 | $23,272 |
| 2022 | $6,347 | $41,880 | $14,100 | $27,780 |
| 2021 | $6,691 | $44,820 | $14,100 | $30,720 |
| 2020 | $6,524 | $41,340 | $14,100 | $27,240 |
| 2019 | $6,083 | $38,640 | $14,100 | $24,540 |
| 2018 | $5,592 | $27,432 | $11,894 | $15,538 |
| 2017 | $5,401 | $26,496 | $12,209 | $14,287 |
| 2016 | $5,297 | $26,496 | $12,209 | $14,287 |
| 2015 | $3,015 | $25,684 | $13,908 | $11,776 |
| 2014 | $3,015 | $24,231 | $14,572 | $9,659 |
Source: Public Records
Map
Nearby Homes
- 120-42 231st St
- 120-43 234th St
- 12031 234th St
- 120-51 234th St
- 0 235th St
- 23107 126th Ave
- 120-47 228th St
- 11919 236th St
- 231-15 128th Rd
- 12819 234th St
- 12831 233rd St
- 12810 236th St
- 11836 236th St
- 23318 118th Ave
- 119-39 226th St
- 118-43 227th St
- 23319 118th Ave
- 120-35 225th St
- 129-08 Francis Lewis Blvd
- 12908 Francis Lewis Blvd
- 120-27 232nd St
- 12031 232nd St
- 12023 232nd St
- 12035 232nd St
- 12019 232nd St
- 12028 233rd St
- 12032 233rd St
- 12024 233rd St
- 120-39 232nd St
- 12039 232nd St
- 12015 232nd St
- 12036 233rd St
- 12020 233rd St
- 12040 233rd St
- 120-40 233rd St
- 12043 232nd St
- 12028 232nd St
- 12016 233rd St
- 12011 232nd St
- 12024 232nd St