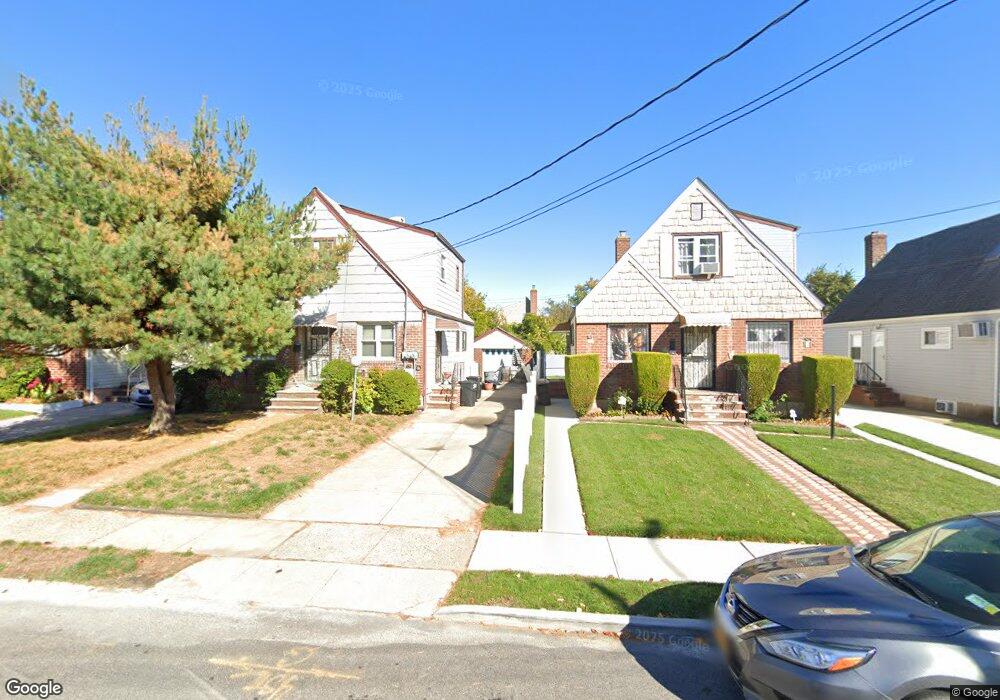
12029 200th St Saint Albans, NY 11412
Saint Albans NeighborhoodEstimated Value: $613,000 - $807,000
--
Bed
--
Bath
1,099
Sq Ft
$656/Sq Ft
Est. Value
About This Home
This home is located at 12029 200th St, Saint Albans, NY 11412 and is currently estimated at $720,537, approximately $655 per square foot. 12029 200th St is a home located in Queens County with nearby schools including P.S. 15 Jackie Robinson, Is 59 Springfield Gardens, and Success Academy Springfield Gardens.
Ownership History
Date
Name
Owned For
Owner Type
Purchase Details
Closed on
Nov 17, 2023
Sold by
Williams Autumn R
Bought by
Williams Tasha D
Current Estimated Value
Home Financials for this Owner
Home Financials are based on the most recent Mortgage that was taken out on this home.
Original Mortgage
$707,744
Outstanding Balance
$695,562
Interest Rate
7.57%
Mortgage Type
Purchase Money Mortgage
Estimated Equity
$24,975
Purchase Details
Closed on
Feb 2, 2018
Sold by
The Estate Of Lawford Paul Williams and Williams Administrator Tasha
Bought by
Williams Tasha D
Home Financials for this Owner
Home Financials are based on the most recent Mortgage that was taken out on this home.
Original Mortgage
$182,000
Interest Rate
3.95%
Mortgage Type
New Conventional
Purchase Details
Closed on
Feb 4, 1999
Sold by
Anderson Dorothy and Williams Louise
Bought by
Williams Lawford Paul and Williams Orville
Create a Home Valuation Report for This Property
The Home Valuation Report is an in-depth analysis detailing your home's value as well as a comparison with similar homes in the area
Home Values in the Area
Average Home Value in this Area
Purchase History
| Date | Buyer | Sale Price | Title Company |
|---|---|---|---|
| Williams Tasha D | -- | -- | |
| Gordon Natifah | $720,800 | -- | |
| Williams Tasha D | -- | -- | |
| Williams Tasha D | -- | -- | |
| Williams Tasha D | -- | -- | |
| Williams Lawford Paul | -- | -- | |
| Williams Lawford Paul | -- | -- |
Source: Public Records
Mortgage History
| Date | Status | Borrower | Loan Amount |
|---|---|---|---|
| Open | Gordon Natifah | $707,744 | |
| Closed | Williams Tasha D | $707,744 | |
| Previous Owner | Williams Tasha D | $182,000 |
Source: Public Records
Tax History Compared to Growth
Tax History
| Year | Tax Paid | Tax Assessment Tax Assessment Total Assessment is a certain percentage of the fair market value that is determined by local assessors to be the total taxable value of land and additions on the property. | Land | Improvement |
|---|---|---|---|---|
| 2025 | $6,145 | $32,428 | $9,364 | $23,064 |
| 2024 | $6,145 | $30,594 | $8,692 | $21,902 |
| 2023 | $5,797 | $28,862 | $7,615 | $21,247 |
| 2022 | $5,762 | $43,500 | $13,740 | $29,760 |
| 2021 | $6,028 | $39,600 | $13,740 | $25,860 |
| 2020 | $5,720 | $37,800 | $13,740 | $24,060 |
| 2019 | $5,333 | $33,240 | $13,740 | $19,500 |
| 2018 | $4,903 | $24,052 | $11,310 | $12,742 |
| 2017 | $4,903 | $24,052 | $10,758 | $13,294 |
| 2016 | $4,772 | $24,052 | $10,758 | $13,294 |
| 2015 | $2,737 | $22,519 | $12,599 | $9,920 |
| 2014 | $2,737 | $21,246 | $11,992 | $9,254 |
Source: Public Records
Map
Nearby Homes
- 120-60 200th St
- 120-46 199th St
- 200-19 119th Ave
- 121-16 198th St
- 120-06 Springfield Blvd
- 118-32 200th St
- 120-15 196th St
- 118-27 201st St
- 12105 196th St
- 118-22 201st
- 121-17 196th St
- 217-24 121st Ave
- 121-9 195th St
- 121-11 195th St
- 118-55 204th St
- 122-52 Springfield Blvd
- 11927 Springfield Blvd
- 197-20 118th Ave
- 118 ave 202 St
- 118-28 204th St
- 12033 200th St
- 12025 200th St
- 12033 200th St
- 120-29 200th St
- 120-33 200th St
- 12019 200th St
- 12037 200th St
- 12019 200th St Unit 2nd Fl
- 12019 200th St Unit 2
- 12019 200th St
- 12019 200th St Unit 2nd Fl
- 12030 201st St
- 12026 201st St
- 120-30 201st St Unit 2
- 12030A 201st St Unit 1st FL
- 12030A 201st St
- 120-30 201st St
- 12030A 201st St
- 12032 201st St Unit 1
- 12032 201st St