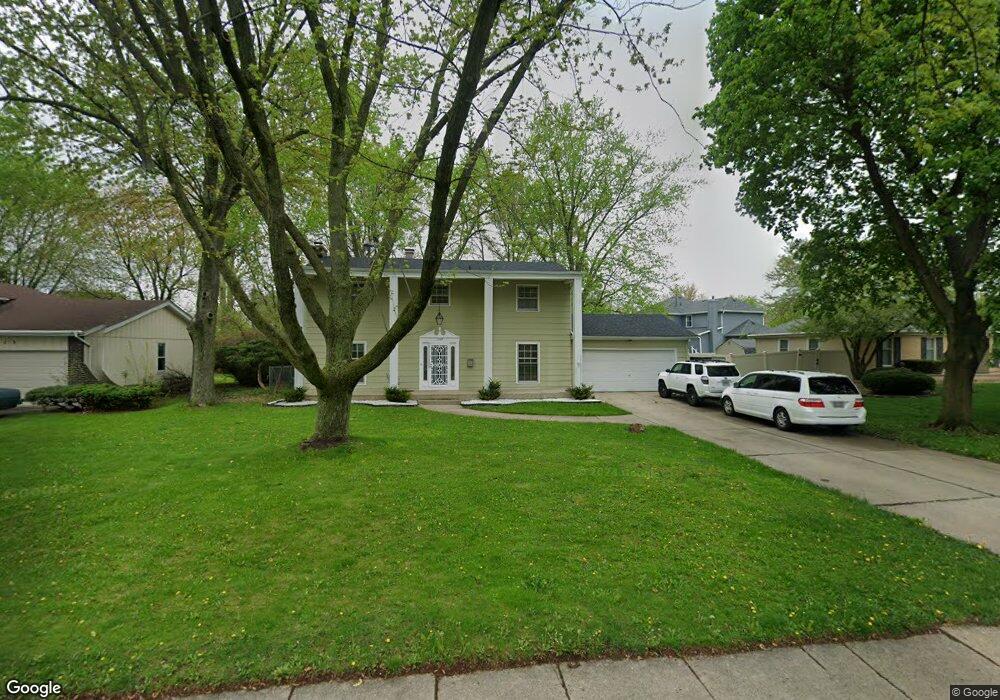
1203 Colorado Ave Unit 2 Aurora, IL 60506
Edgelawn Randall NeighborhoodEstimated Value: $338,345 - $371,000
4
Beds
--
Bath
2,132
Sq Ft
$167/Sq Ft
Est. Value
About This Home
This home is located at 1203 Colorado Ave Unit 2, Aurora, IL 60506 and is currently estimated at $356,586, approximately $167 per square foot. 1203 Colorado Ave Unit 2 is a home located in Kane County with nearby schools including Mccleery Elementary School, Jefferson Middle School, and West Aurora High School.
Ownership History
Date
Name
Owned For
Owner Type
Purchase Details
Closed on
Mar 20, 2000
Sold by
Hud
Bought by
Ochoa Perfecto and Ochoa Margarita
Current Estimated Value
Home Financials for this Owner
Home Financials are based on the most recent Mortgage that was taken out on this home.
Original Mortgage
$30,000
Interest Rate
8.31%
Purchase Details
Closed on
Jan 18, 2000
Sold by
Palombo Richard C
Bought by
Hud
Purchase Details
Closed on
Aug 11, 1997
Sold by
Palombo Richard
Bought by
Palombo Richard and Palombo Lisa
Home Financials for this Owner
Home Financials are based on the most recent Mortgage that was taken out on this home.
Original Mortgage
$140,082
Interest Rate
7.54%
Mortgage Type
FHA
Purchase Details
Closed on
Jul 30, 1997
Sold by
Adkins Donald L and Adkins Barbara B
Bought by
Palombo Ii Richard C
Home Financials for this Owner
Home Financials are based on the most recent Mortgage that was taken out on this home.
Original Mortgage
$140,082
Interest Rate
7.54%
Mortgage Type
FHA
Create a Home Valuation Report for This Property
The Home Valuation Report is an in-depth analysis detailing your home's value as well as a comparison with similar homes in the area
Home Values in the Area
Average Home Value in this Area
Purchase History
| Date | Buyer | Sale Price | Title Company |
|---|---|---|---|
| Ochoa Perfecto | -- | -- | |
| Hud | -- | -- | |
| Palombo Richard | -- | -- | |
| Palombo Ii Richard C | $96,666 | Attorneys National Title |
Source: Public Records
Mortgage History
| Date | Status | Borrower | Loan Amount |
|---|---|---|---|
| Closed | Ochoa Perfecto | $30,000 | |
| Previous Owner | Palombo Ii Richard C | $140,082 |
Source: Public Records
Tax History Compared to Growth
Tax History
| Year | Tax Paid | Tax Assessment Tax Assessment Total Assessment is a certain percentage of the fair market value that is determined by local assessors to be the total taxable value of land and additions on the property. | Land | Improvement |
|---|---|---|---|---|
| 2024 | $4,912 | $102,811 | $15,912 | $86,899 |
| 2023 | $5,313 | $91,861 | $14,217 | $77,644 |
| 2022 | $5,934 | $83,815 | $12,972 | $70,843 |
| 2021 | $6,124 | $78,033 | $12,077 | $65,956 |
| 2020 | $6,224 | $72,481 | $11,218 | $61,263 |
| 2019 | $5,980 | $67,156 | $10,394 | $56,762 |
| 2018 | $5,733 | $63,431 | $9,614 | $53,817 |
| 2017 | $6,073 | $65,005 | $8,858 | $56,147 |
| 2016 | $5,394 | $56,778 | $7,593 | $49,185 |
| 2015 | -- | $49,376 | $6,529 | $42,847 |
| 2014 | -- | $47,488 | $6,279 | $41,209 |
| 2013 | -- | $46,812 | $6,190 | $40,622 |
Source: Public Records
Map
Nearby Homes
- 1296 Yellowpine Dr
- 1351 Monomoy St Unit D
- 1389 Monomoy St Unit B2
- 833 N Randall Rd Unit C4
- 1104 New Haven Ave
- 795 N Elmwood Dr
- 781 N Elmwood Dr
- 1035 Newcastle Ln
- 972 Westgate Dr
- 910 Southbridge Dr
- 1532 Golden Oaks Pkwy
- 616 Morton Ave
- 1199 Pin Oak Trail
- 943 Charles St
- 967 Sapphire Ln
- 959 Sapphire Ln
- 963 Sapphire Ln
- 960 Sapphire Ln
- 964 Sapphire Ln
- 900 Charles St
- 1213 Colorado Ave
- 1191 Colorado Ave
- 992 Legrande Ave
- 1226 Cottonwood Dr
- 1218 Cottonwood Dr
- 1227 Colorado Ave
- 1202 Colorado Ave
- 1210 Cottonwood Dr
- 1212 Colorado Ave
- 1234 Cottonwood Dr
- 1190 Colorado Ave Unit 2
- 1241 Colorado Ave Unit 2
- 1220 Colorado Ave
- 1170 Colorado Ave
- 1242 Cottonwood Dr
- 989 Legrande Ave
- 1155 Colorado Ave
- 1223 California Ave
- 1231 California Ave Unit 3
- 997 Legrande Ave