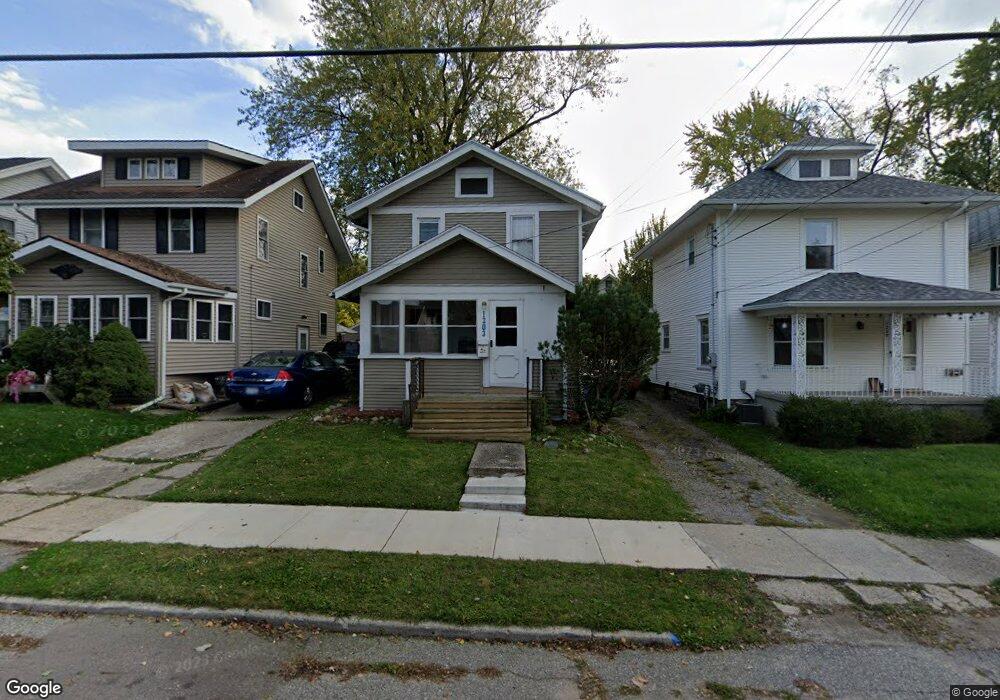
1203 Edward St Lansing, MI 48910
Quentin Park NeighborhoodEstimated Value: $128,000 - $149,000
3
Beds
1
Bath
1,040
Sq Ft
$137/Sq Ft
Est. Value
About This Home
This home is located at 1203 Edward St, Lansing, MI 48910 and is currently estimated at $142,307, approximately $136 per square foot. 1203 Edward St is a home located in Ingham County with nearby schools including Averill Elementary School, Pattengill Academy, and J.W. Sexton High School.
Ownership History
Date
Name
Owned For
Owner Type
Purchase Details
Closed on
Apr 14, 2016
Sold by
Souri George M and Souri Mireille C
Bought by
The Souri Family Trust
Current Estimated Value
Purchase Details
Closed on
Jan 27, 2011
Sold by
Souri George M
Bought by
Souri George M and Souri Mireille J
Purchase Details
Closed on
Jan 7, 2009
Sold by
Federal National Mortgage Association
Bought by
Souri George
Purchase Details
Closed on
Oct 21, 2008
Sold by
Mortgage Electronic Registration Systems
Bought by
Federal National Mortgage Association
Purchase Details
Closed on
Oct 16, 2008
Sold by
James Jeremy
Bought by
Mortgage Electronic Registration Systems
Purchase Details
Closed on
Jul 9, 2003
Sold by
Schlife John E and Schlife Susan J
Bought by
James Jeremy
Home Financials for this Owner
Home Financials are based on the most recent Mortgage that was taken out on this home.
Original Mortgage
$65,000
Interest Rate
5.3%
Mortgage Type
Purchase Money Mortgage
Purchase Details
Closed on
Apr 25, 2003
Sold by
Schlife John E
Bought by
James Jeremy
Create a Home Valuation Report for This Property
The Home Valuation Report is an in-depth analysis detailing your home's value as well as a comparison with similar homes in the area
Home Values in the Area
Average Home Value in this Area
Purchase History
| Date | Buyer | Sale Price | Title Company |
|---|---|---|---|
| The Souri Family Trust | -- | None Available | |
| Souri George M | -- | None Available | |
| Souri George | $11,500 | Warranty Title Agency Llc | |
| Federal National Mortgage Association | -- | None Available | |
| Mortgage Electronic Registration Systems | $64,975 | None Available | |
| James Jeremy | $60,000 | Midstate Title Co | |
| James Jeremy | -- | Fatic |
Source: Public Records
Mortgage History
| Date | Status | Borrower | Loan Amount |
|---|---|---|---|
| Previous Owner | James Jeremy | $65,000 |
Source: Public Records
Tax History
| Year | Tax Paid | Tax Assessment Tax Assessment Total Assessment is a certain percentage of the fair market value that is determined by local assessors to be the total taxable value of land and additions on the property. | Land | Improvement |
|---|---|---|---|---|
| 2025 | $3,162 | $59,100 | $5,800 | $53,300 |
| 2024 | $26 | $53,900 | $5,800 | $48,100 |
| 2023 | $2,976 | $48,000 | $5,800 | $42,200 |
| 2022 | $2,716 | $43,900 | $6,400 | $37,500 |
| 2021 | $2,653 | $40,700 | $5,200 | $35,500 |
| 2020 | $2,635 | $38,000 | $5,200 | $32,800 |
| 2019 | $2,546 | $35,000 | $5,200 | $29,800 |
| 2018 | $2,414 | $33,800 | $5,200 | $28,600 |
| 2017 | $2,324 | $33,800 | $5,200 | $28,600 |
| 2016 | $2,231 | $32,300 | $5,200 | $27,100 |
| 2015 | $2,231 | $31,200 | $10,341 | $20,859 |
| 2014 | $2,231 | $29,700 | $11,966 | $17,734 |
Source: Public Records
Map
Nearby Homes
- 1309 Hammond St
- 1116 George St
- 1017 W Barnes Ave
- 1120 Alsdorf St
- 1114 Goodrich St
- 1511 Pattengill Ave
- 1312 W Mount Hope Ave
- 1400 Pico Ave
- 1221 Moores River Dr
- 1319 Pico Ave
- 1327 Moores River Dr
- 815 Smith Ave
- 900 W Mount Hope Ave
- 2001 S Martin Luther King Junior Blvd
- 717 Smith Ave
- 1323 Cooper Ave
- 1517 Lenore Ave
- 1534 Lenore Ave
- 1516 Moores River Dr
- 1740 Wellington Rd Unit 103
- 1205 Edward St
- 1129 Edward St
- 1207 Edward St
- 1125 Edward St
- 1211 Edward St
- 1204 W Barnes Ave
- 1128 W Barnes Ave
- 1206 W Barnes Ave
- 1119 Edward St
- 1213 Edward St
- 1122 W Barnes Ave
- 1210 W Barnes Ave
- 1200 Edward St
- 1126 Edward St
- 1217 Edward St
- 1212 W Barnes Ave
- 1208 Edward St
- 1122 Edward St
- 1116 W Barnes Ave
- 1216 W Barnes Ave
Your Personal Tour Guide
Ask me questions while you tour the home.