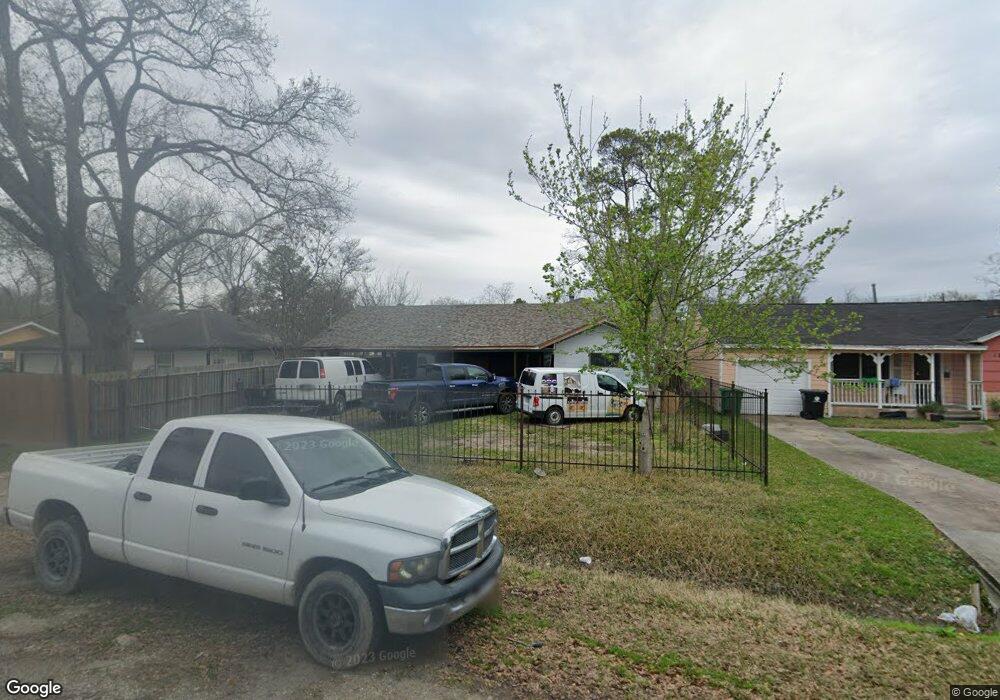
1203 Eubanks St Houston, TX 77022
Northside-Northline NeighborhoodEstimated Value: $206,000 - $264,000
5
Beds
2
Baths
2,364
Sq Ft
$101/Sq Ft
Est. Value
About This Home
This home is located at 1203 Eubanks St, Houston, TX 77022 and is currently estimated at $238,082, approximately $100 per square foot. 1203 Eubanks St is a home located in Harris County with nearby schools including Janowski Elementary School, Burbank Middle School, and Sam Houston Math, Science & Technology Center.
Ownership History
Date
Name
Owned For
Owner Type
Purchase Details
Closed on
Jun 1, 2020
Sold by
Prw Holdings Llc
Bought by
De Torres Martha Florida Guerrero and Torres Martha Florida
Current Estimated Value
Home Financials for this Owner
Home Financials are based on the most recent Mortgage that was taken out on this home.
Original Mortgage
$131,500
Interest Rate
2.9%
Mortgage Type
New Conventional
Purchase Details
Closed on
Apr 7, 2020
Sold by
Rodriguez Aurora M
Bought by
Prw Holdings Llc
Home Financials for this Owner
Home Financials are based on the most recent Mortgage that was taken out on this home.
Original Mortgage
$131,500
Interest Rate
2.9%
Mortgage Type
New Conventional
Purchase Details
Closed on
Apr 18, 1994
Sold by
Contreras Theresa
Bought by
Rodriguez Aurora M
Create a Home Valuation Report for This Property
The Home Valuation Report is an in-depth analysis detailing your home's value as well as a comparison with similar homes in the area
Home Values in the Area
Average Home Value in this Area
Purchase History
| Date | Buyer | Sale Price | Title Company |
|---|---|---|---|
| De Torres Martha Florida Guerrero | -- | None Available | |
| Prw Holdings Llc | -- | Providence Title Company | |
| Rodriguez Aurora M | -- | -- |
Source: Public Records
Mortgage History
| Date | Status | Borrower | Loan Amount |
|---|---|---|---|
| Previous Owner | De Torres Martha Florida Guerrero | $131,500 |
Source: Public Records
Tax History
| Year | Tax Paid | Tax Assessment Tax Assessment Total Assessment is a certain percentage of the fair market value that is determined by local assessors to be the total taxable value of land and additions on the property. | Land | Improvement |
|---|---|---|---|---|
| 2025 | $4,757 | $238,000 | $93,586 | $144,414 |
| 2024 | $4,757 | $227,361 | $85,890 | $141,471 |
| 2023 | $4,757 | $275,154 | $52,335 | $222,819 |
| 2022 | $5,042 | $229,005 | $52,335 | $176,670 |
| 2021 | $4,701 | $201,682 | $52,335 | $149,347 |
| 2020 | $4,111 | $184,160 | $52,335 | $131,825 |
| 2019 | $3,906 | $184,160 | $43,099 | $141,061 |
| 2018 | $600 | $140,311 | $36,018 | $104,293 |
| 2017 | $3,545 | $140,311 | $36,018 | $104,293 |
| 2016 | $3,223 | $127,462 | $33,864 | $93,598 |
| 2015 | $855 | $123,545 | $24,628 | $98,917 |
| 2014 | $855 | $123,545 | $24,628 | $98,917 |
Source: Public Records
Map
Nearby Homes
- 8109 W Hardy Rd
- 1815 Eubanks St
- 743 Apache St
- 1104 Charnwood St
- 741 Mcdaniel St
- 726 Mcdaniel St
- 714 Apache St
- 909 Yorkshire St Unit 8
- 916 Berry Rd
- 720 Caperton St
- 1115 Post St
- 2017 Sadler St
- 822 Berry Sage Ln
- 8440 Berry Brush Ln
- 7714 Helmers St
- 802 Berry Sage Ln
- 2405 Mann St
- 2418 Deams St
- 1009 Wainwright St
- 525 Eubanks St
- 1205 Eubanks St
- 1111 Eubanks St
- 1107 Eubanks St
- 1212 Apache St
- 1218 Apache St
- 1202 Apache St
- 1222 Apache St
- 1105 Eubanks St
- 1202 Eubanks St
- 1112 Eubanks St
- 1210 Eubanks St
- 1103 Eubanks St
- 1110 Eubanks St
- 1106 Eubanks St
- 1218 Eubanks St
- 1222 Eubanks St
- 1102 Eubanks St
- 1219 Apache St
- 1309 Apache St
- 1209 Apache St
Your Personal Tour Guide
Ask me questions while you tour the home.