Estimated Value: $104,681 - $137,000
3
Beds
1
Bath
1,056
Sq Ft
$120/Sq Ft
Est. Value
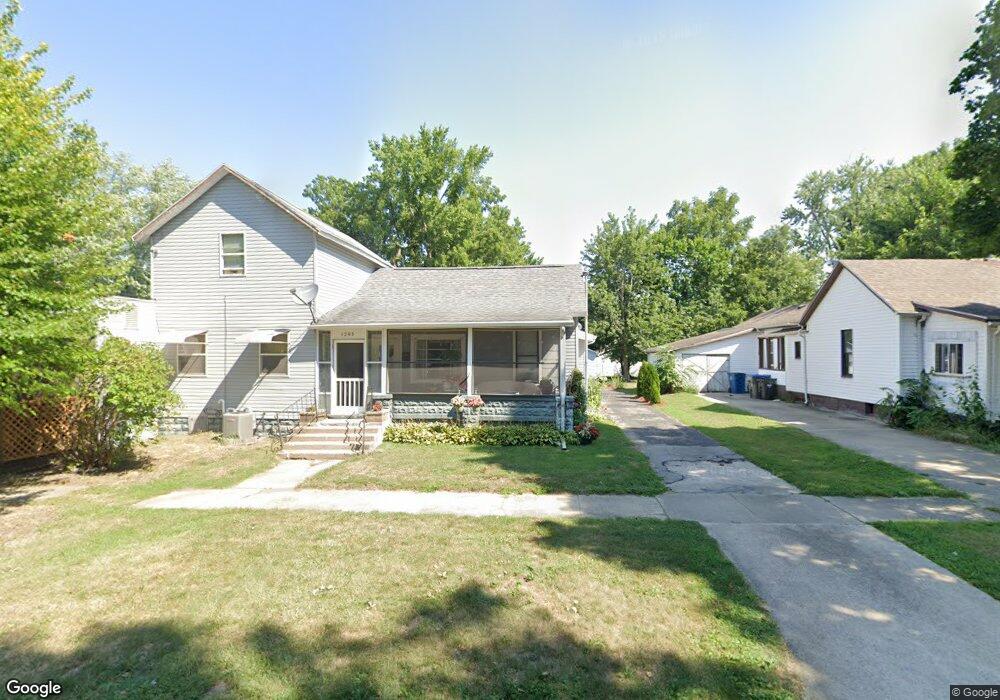
About This Home
This home is located at 1203 Ferry St, Niles, MI 49120 and is currently estimated at $126,920, approximately $120 per square foot. 1203 Ferry St is a home located in Berrien County with nearby schools including Ballard Elementary School, Ring Lardner Middle School, and Oak Manor Sixth Grade Center.
Ownership History
Date
Name
Owned For
Owner Type
Purchase Details
Closed on
Jul 30, 2025
Sold by
Nelson Ronald Brian
Bought by
Nelson Clayton Tyler
Current Estimated Value
Purchase Details
Closed on
Aug 17, 2021
Sold by
Nelson Ronald Brian
Bought by
Nelson Ronald Brian and Nelson Clayton Tyler
Purchase Details
Closed on
Jul 2, 2020
Sold by
Coffey Connie J and Taylor Margaret
Bought by
Taylor Kathy M
Purchase Details
Closed on
Mar 1, 2018
Sold by
Nelson Ronald Brian
Bought by
Belson Ronald Brian and Bailey Krystal Gayle
Purchase Details
Closed on
Apr 22, 2011
Sold by
George Mable Jean and George Sharlin
Bought by
Nelson Ronald Brian
Purchase Details
Closed on
Mar 10, 2006
Sold by
Estate Of Nevada Rossow
Bought by
Nelson Ronald Brian
Create a Home Valuation Report for This Property
The Home Valuation Report is an in-depth analysis detailing your home's value as well as a comparison with similar homes in the area
Home Values in the Area
Average Home Value in this Area
Purchase History
| Date | Buyer | Sale Price | Title Company |
|---|---|---|---|
| Nelson Clayton Tyler | -- | None Listed On Document | |
| Nelson Ronald Brian | -- | None Available | |
| Nelson Ronald Brian | -- | None Listed On Document | |
| Taylor Kathy M | -- | None Available | |
| Belson Ronald Brian | -- | None Available | |
| Nelson Ronald Brian | $15,000 | None Available | |
| Nelson Ronald Brian | -- | None Available |
Source: Public Records
Tax History
| Year | Tax Paid | Tax Assessment Tax Assessment Total Assessment is a certain percentage of the fair market value that is determined by local assessors to be the total taxable value of land and additions on the property. | Land | Improvement |
|---|---|---|---|---|
| 2025 | $787 | $36,100 | $0 | $0 |
| 2024 | $603 | $32,100 | $0 | $0 |
| 2023 | $578 | $26,600 | $0 | $0 |
| 2022 | $550 | $20,400 | $0 | $0 |
| 2021 | $685 | $19,400 | $800 | $18,600 |
| 2020 | $677 | $18,200 | $0 | $0 |
| 2019 | $669 | $17,000 | $500 | $16,500 |
| 2018 | $677 | $17,000 | $0 | $0 |
| 2017 | $760 | $20,900 | $0 | $0 |
| 2016 | $744 | $20,600 | $0 | $0 |
| 2015 | $742 | $19,500 | $0 | $0 |
| 2014 | $585 | $19,600 | $0 | $0 |
Source: Public Records
Map
Nearby Homes
Your Personal Tour Guide
Ask me questions while you tour the home.